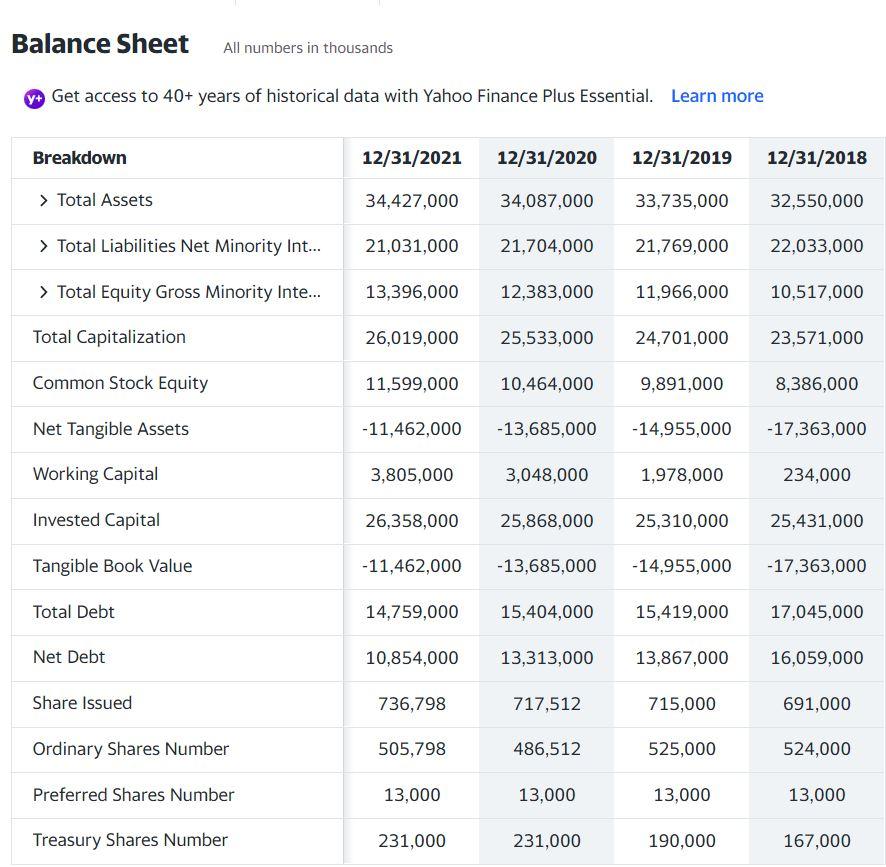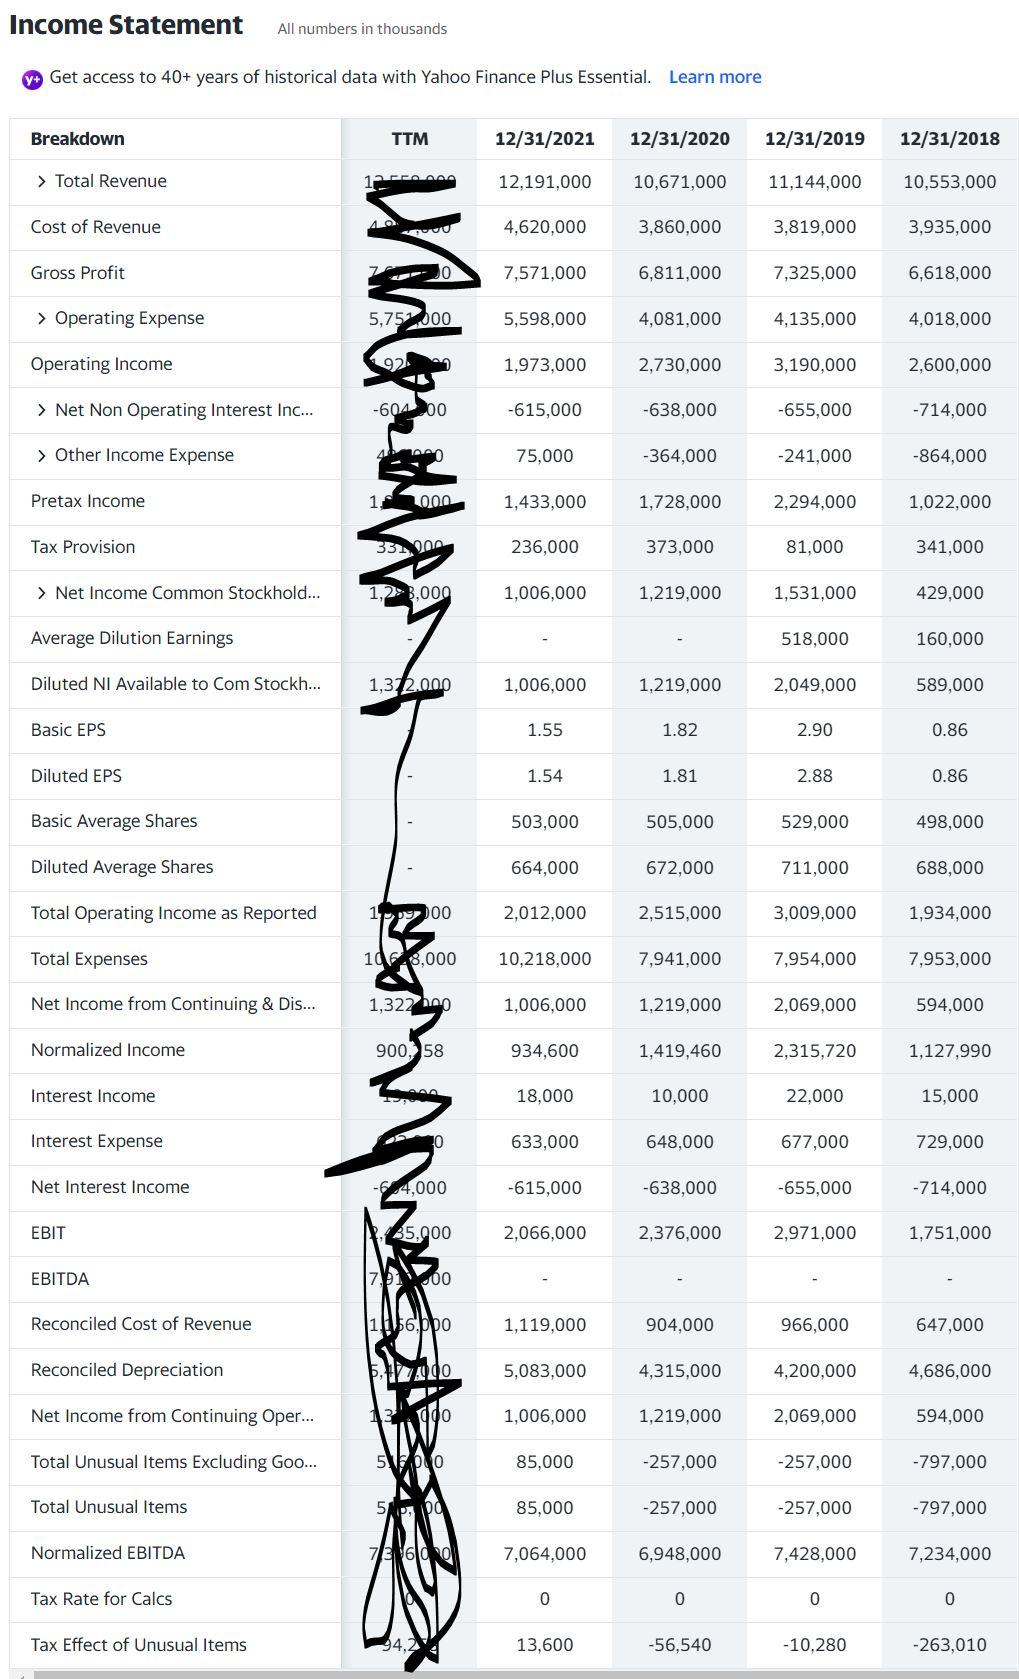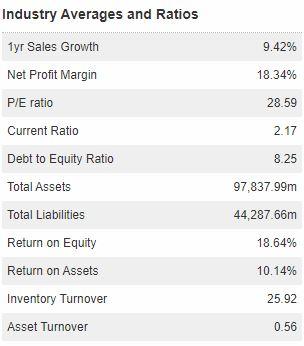


Based on the financial statements above, you are going to conduct a simple ratio analysis by comparing this companys key financial ratios with industry benchmarks. from the Industry benchmark financial Average ratios table above. We will focus on the most recent fiscal year available (i.e., year 2021 or 2022).
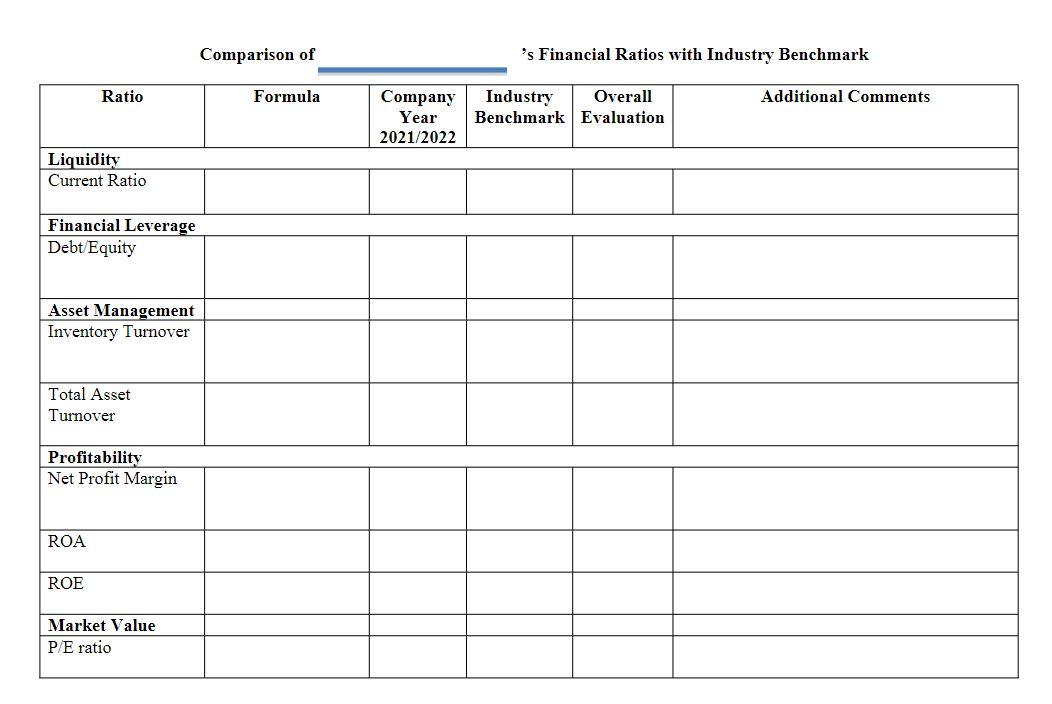
Please complete the following: A. Complete the worksheet attached to this document on the next page. To find industry benchmark ratios, please access the Factiva database via Smith Library website, hover your cursor over Companies/Markets, then click on Industry. Select the industry that applies. Find industry benchmark ratios from the Industry Averages and Ratios section. All the financial ratios for the company youve picked need to be calculated.
 B. Based on the comparison of financial ratios, briefly evaluate the companys performance/financial health in the latest fiscal year from the five perspectives of liquidity, financial leverage, asset management, profitability, and market value. Use Du Pont analysis in your interpretation of the companys ROE. You may also comment on the companys stock performance in 2021/2022. Please attach the worksheet and the companys financial statements to your analysis. Your analysis itself (excluding the worksheet and other attachments) should not exceed two pages.
Warner Bros. Discovery, Inc. (WBD) NasdaqGs - NasdaqGs Real Time Price. Currency in USD Add to watchlist 29 Visitors 17.10 -0.65 (-3.66%) 17.05 -0.05 (-0.29%) At close: 04:00PM EDT After hours: 07:55PM EDT Balance Sheet All numbers in thousands + Get access to 40+ years of historical data with Yahoo Finance Plus Essential. Learn more Breakdown 12/31/2021 12/31/2020 12/31/2019 12/31/2018 > Total Assets 34,427,000 34,087,000 33,735,000 32,550,000 > Total Liabilities Net Minority Int... 21,031,000 21,704,000 21,769,000 22,033,000 > Total Equity Gross Minority Inte... 13,396,000 12,383,000 11,966,000 10,517,000 Total Capitalization 26,019,000 25,533,000 24,701,000 23,571,000 Common Stock Equity 11,599,000 10,464,000 9,891,000 8,386,000 Net Tangible Assets -11,462,000 -13,685,000 -14,955,000 -17,363,000 Working Capital 3,805,000 3,048,000 1,978,000 234,000 Invested Capital 26,358,000 25,868,000 25,310,000 25,431,000 Tangible Book Value -11,462,000 -13,685,000 -14,955,000 -17,363,000 Total Debt 14,759,000 15,404,000 15,419,000 17,045,000 Net Debt 10,854,000 13,313,000 13,867,000 16,059,000 Share Issued 736,798 717,512 715,000 691,000 Ordinary Shares Number 505,798 486,512 525,000 524,000 Preferred Shares Number 13,000 13,000 13,000 13,000 Treasury Shares Number 231,000 231,000 190,000 167,000 Income Statement All numbers in thousands Get access to 40+ years of historical data with Yahoo Finance Plus Essential. Learn more Breakdown TTM 12/31/2021 12/31/2020 12/31/2019 12/31/2018 > Total Revenue 12,191,000 10,671,000 11,144,000 10,553,000 Cost of Revenue 4,620,000 3,860,000 3,819,000 3,935,000 Gross Profit 7,571,000 6,811,000 7,325,000 6,618,000 who > Operating Expense 5,757.000 5,598,000 4,081,000 4,135,000 4,018,000 Operating Income 1,973,000 2,730,000 3,190,000 2,600,000 > Net Non Operating Interest Inc... -60400 -615,000 -638,000 -655,000 -714,000 > Other Income Expense 75,000 -364,000 -241,000 -864,000 Pretax Income 1 0,00 1,433,000 1,728,000 2,294,000 1,022,000 Tax Provision 33 236,000 373,000 81,000 341,000 > Net Income Common Stockhold... 1,23.000 1,006,000 1,219,000 1,531,000 429,000 Average Dilution Earnings 518,000 160,000 Diluted NI Available to Com Stockh... 1,312.000 1,006,000 1,219,000 2,049,000 589,000 Basic EPS 1.55 1.82 2.90 0.86 Diluted EPS 1.54 1.81 2.88 0.86 Basic Average Shares 503,000 505,000 529,000 498,000 Diluted Average Shares 664,000 672,000 711,000 688,000 Total Operating Income as Reported 1,900 2,012,000 2,515,000 3,009,000 1,934,000 Total Expenses 10 68,000 10,218,000 7,941,000 7,954,000 7,953,000 Net Income from Continuing & Dis... 1,322 hop 1,006,000 1,219,000 2,069,000 594,000 Normalized Income 900, 58 934,600 1,419,460 2,315,720 1,127,990 Interest Income 18,000 10,000 22,000 15,000 Interest Expense 10 633,000 648,000 677,000 729,000 Net Interest Income -624.000 -615,000 -638,000 -655,000 -714,000 EBIT 85.900 2,066,000 2,376,000 2,971,000 1,751,000 EBITDA 000 Reconciled Cost of Revenue 16.ppo 1,119,000 904,000 966,000 647,000 Reconciled Depreciation 200 5,083,000 4,315,000 4,200,000 4,686,000 Net Income from Continuing Oper... 0 1,006,000 1,219,000 2,069,000 594,000 Total Unusual Items Excluding Goo... 510 85,000 -257,000 -257,000 -797,000 Total Unusual Items 5APPO 85,000 -257,000 -257,000 -797,000 Normalized EBITDA 7N60 7,064,000 6,948,000 7,428,000 7,234,000 Tax Rate for Calcs 0 0 o 0 Tax Effect of Unusual Items 94,2 13,600 -56,540 -10,280 -263,010 9.42% Industry Averages and Ratios 1yr Sales Growth Net Profit Margin P/E ratio Current Ratio 18.34% % 28.59 2.17 8.25 Debt to Equity Ratio Total Assets Total Liabilities 97,837.99m 44,287.66m Return on Equity 18.64% Return on Assets 10.14% Inventory Turnover 25.92 Asset Turnover 0.56 Comparison of 's Financial Ratios with Industry Benchmark Ratio Formula Company Year 2021/2022 Industry Overall Benchmark Evaluation Additional Comments Liquidity Current Ratio Financial Leverage Debt Equity Asset Management Inventory Turnover Total Asset Turnover Profitability Net Profit Margin ROA ROE Market Value P/E ratio Warner Bros. Discovery, Inc. (WBD) NasdaqGs - NasdaqGs Real Time Price. Currency in USD Add to watchlist 29 Visitors 17.10 -0.65 (-3.66%) 17.05 -0.05 (-0.29%) At close: 04:00PM EDT After hours: 07:55PM EDT Balance Sheet All numbers in thousands + Get access to 40+ years of historical data with Yahoo Finance Plus Essential. Learn more Breakdown 12/31/2021 12/31/2020 12/31/2019 12/31/2018 > Total Assets 34,427,000 34,087,000 33,735,000 32,550,000 > Total Liabilities Net Minority Int... 21,031,000 21,704,000 21,769,000 22,033,000 > Total Equity Gross Minority Inte... 13,396,000 12,383,000 11,966,000 10,517,000 Total Capitalization 26,019,000 25,533,000 24,701,000 23,571,000 Common Stock Equity 11,599,000 10,464,000 9,891,000 8,386,000 Net Tangible Assets -11,462,000 -13,685,000 -14,955,000 -17,363,000 Working Capital 3,805,000 3,048,000 1,978,000 234,000 Invested Capital 26,358,000 25,868,000 25,310,000 25,431,000 Tangible Book Value -11,462,000 -13,685,000 -14,955,000 -17,363,000 Total Debt 14,759,000 15,404,000 15,419,000 17,045,000 Net Debt 10,854,000 13,313,000 13,867,000 16,059,000 Share Issued 736,798 717,512 715,000 691,000 Ordinary Shares Number 505,798 486,512 525,000 524,000 Preferred Shares Number 13,000 13,000 13,000 13,000 Treasury Shares Number 231,000 231,000 190,000 167,000 Income Statement All numbers in thousands Get access to 40+ years of historical data with Yahoo Finance Plus Essential. Learn more Breakdown TTM 12/31/2021 12/31/2020 12/31/2019 12/31/2018 > Total Revenue 12,191,000 10,671,000 11,144,000 10,553,000 Cost of Revenue 4,620,000 3,860,000 3,819,000 3,935,000 Gross Profit 7,571,000 6,811,000 7,325,000 6,618,000 who > Operating Expense 5,757.000 5,598,000 4,081,000 4,135,000 4,018,000 Operating Income 1,973,000 2,730,000 3,190,000 2,600,000 > Net Non Operating Interest Inc... -60400 -615,000 -638,000 -655,000 -714,000 > Other Income Expense 75,000 -364,000 -241,000 -864,000 Pretax Income 1 0,00 1,433,000 1,728,000 2,294,000 1,022,000 Tax Provision 33 236,000 373,000 81,000 341,000 > Net Income Common Stockhold... 1,23.000 1,006,000 1,219,000 1,531,000 429,000 Average Dilution Earnings 518,000 160,000 Diluted NI Available to Com Stockh... 1,312.000 1,006,000 1,219,000 2,049,000 589,000 Basic EPS 1.55 1.82 2.90 0.86 Diluted EPS 1.54 1.81 2.88 0.86 Basic Average Shares 503,000 505,000 529,000 498,000 Diluted Average Shares 664,000 672,000 711,000 688,000 Total Operating Income as Reported 1,900 2,012,000 2,515,000 3,009,000 1,934,000 Total Expenses 10 68,000 10,218,000 7,941,000 7,954,000 7,953,000 Net Income from Continuing & Dis... 1,322 hop 1,006,000 1,219,000 2,069,000 594,000 Normalized Income 900, 58 934,600 1,419,460 2,315,720 1,127,990 Interest Income 18,000 10,000 22,000 15,000 Interest Expense 10 633,000 648,000 677,000 729,000 Net Interest Income -624.000 -615,000 -638,000 -655,000 -714,000 EBIT 85.900 2,066,000 2,376,000 2,971,000 1,751,000 EBITDA 000 Reconciled Cost of Revenue 16.ppo 1,119,000 904,000 966,000 647,000 Reconciled Depreciation 200 5,083,000 4,315,000 4,200,000 4,686,000 Net Income from Continuing Oper... 0 1,006,000 1,219,000 2,069,000 594,000 Total Unusual Items Excluding Goo... 510 85,000 -257,000 -257,000 -797,000 Total Unusual Items 5APPO 85,000 -257,000 -257,000 -797,000 Normalized EBITDA 7N60 7,064,000 6,948,000 7,428,000 7,234,000 Tax Rate for Calcs 0 0 o 0 Tax Effect of Unusual Items 94,2 13,600 -56,540 -10,280 -263,010 9.42% Industry Averages and Ratios 1yr Sales Growth Net Profit Margin P/E ratio Current Ratio 18.34% % 28.59 2.17 8.25 Debt to Equity Ratio Total Assets Total Liabilities 97,837.99m 44,287.66m Return on Equity 18.64% Return on Assets 10.14% Inventory Turnover 25.92 Asset Turnover 0.56 Comparison of 's Financial Ratios with Industry Benchmark Ratio Formula Company Year 2021/2022 Industry Overall Benchmark Evaluation Additional Comments Liquidity Current Ratio Financial Leverage Debt Equity Asset Management Inventory Turnover Total Asset Turnover Profitability Net Profit Margin ROA ROE Market Value P/E ratio


 B. Based on the comparison of financial ratios, briefly evaluate the companys performance/financial health in the latest fiscal year from the five perspectives of liquidity, financial leverage, asset management, profitability, and market value. Use Du Pont analysis in your interpretation of the companys ROE. You may also comment on the companys stock performance in 2021/2022. Please attach the worksheet and the companys financial statements to your analysis. Your analysis itself (excluding the worksheet and other attachments) should not exceed two pages.


