Answered step by step
Verified Expert Solution
Question
1 Approved Answer
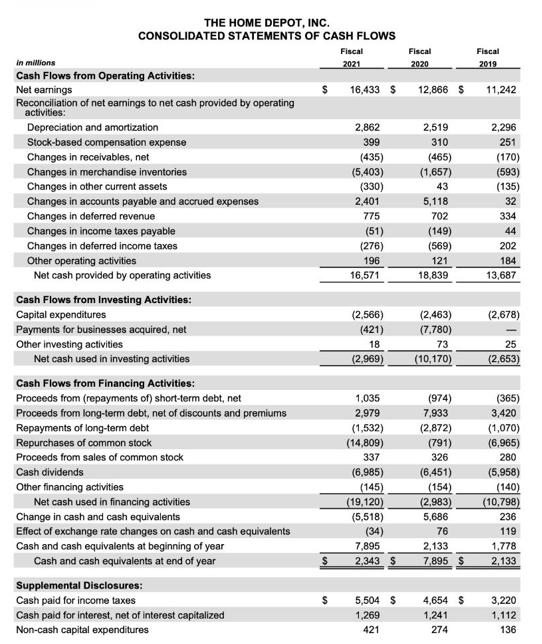
Based on the financial statements of Home Depot for the fiscal year that ended January 30, 2022, calculate the following ratios for the last two
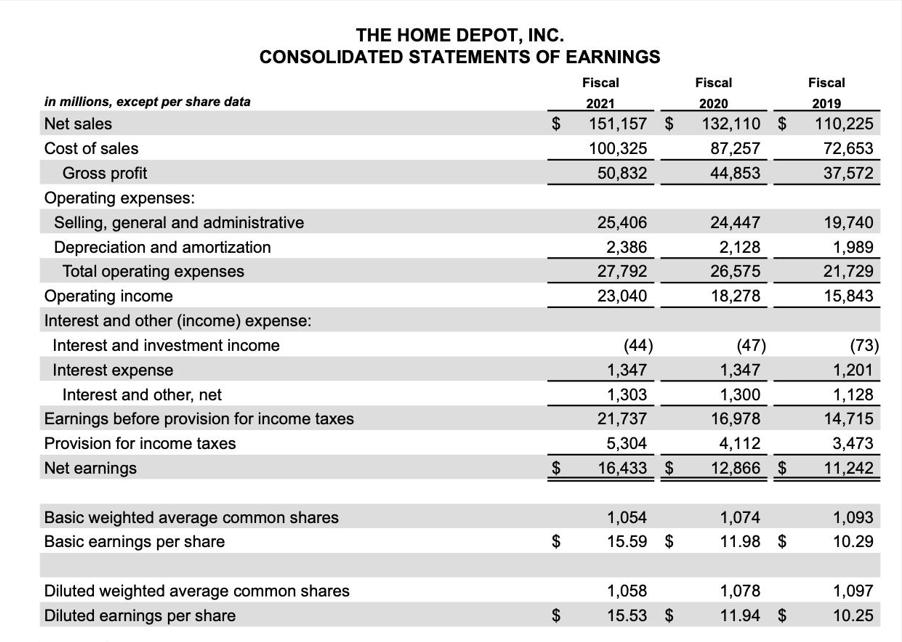
Based on the financial statements of Home Depot for the fiscal year that ended January 30, 2022, calculate the following ratios for the last two fiscal years and indicate whether they are getting better or worse:
Ratio FYE 1/30/2022 FYE 1/31/2021 Better/Worse
Inventory Turnover(x)
After Tax Operating Income
Return on Common Equity (%)
Total Debt to Total Capital (%)
Return on Invested Capital (%)
Basic Earning Power (%)
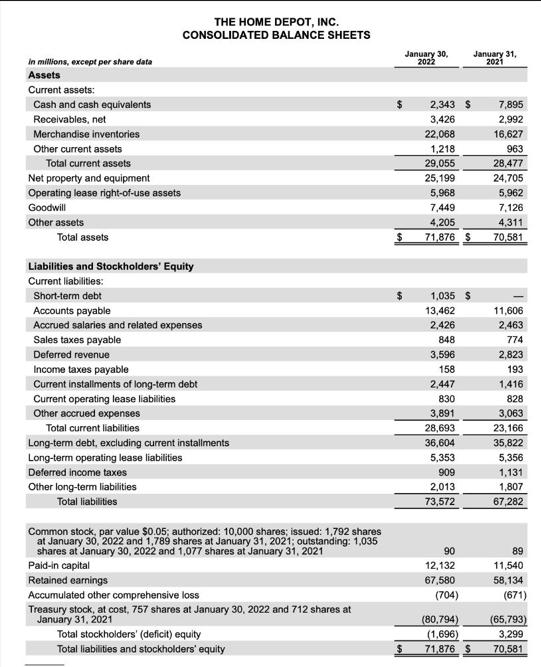
in millions, except per share data Assets Current assets: Cash and cash equivalents Receivables, net Merchandise inventories Other current assets Total current assets Net property and equipment Operating lease right-of-use assets Goodwill Other assets Total assets THE HOME DEPOT, INC. CONSOLIDATED BALANCE SHEETS Liabilities and Stockholders' Equity Current liabilities: Short-term debt Accounts payable Accrued salaries and related expenses Sales taxes payable Deferred revenue Income taxes payable Current installments of long-term debt Current operating lease liabilities Other accrued expenses Total current liabilities Long-term debt, excluding current installments Long-term operating lease liabilities Deferred income taxes Other long-term liabilities Total liabilities Common stock, par value $0.05; authorized: 10,000 shares; issued: 1,792 shares at January 30, 2022 and 1,789 shares at January 31, 2021; outstanding: 1,035 shares at January 30, 2022 and 1,077 shares at January 31, 2021 Paid-in capital Retained earnings Accumulated other comprehensive loss Treasury stock, at cost, 757 shares at January 30, 2022 and 712 shares at January 31, 2021 Total stockholders' (deficit) equity Total liabilities and stockholders' equity January 30, 2022 2,343 S 3,426 22,068 1,218 29,055 25,199 5,968 7,449 4,205 $ 71,876 $ $ 1,035 $ 13,462 2,426 848 3,596 158 2,447 830 3,891 28,693 36,604 5,353 909 2,013 73,572 90 12,132 67,580 (704) (80,794) (1,696) 71,876 $ January 31, 2021 7,895 2,992 16,627 963 28,477 24,705 5,962 7,126 4,311 70,581 11,606 2,463 774 2,823 193 1,416 828 3,063 23,166 35,822 5,356 1,131 1,807 67,282 89 11,540 58,134 (671) (65,793) 3,299 70,581
Step by Step Solution
★★★★★
3.41 Rating (157 Votes )
There are 3 Steps involved in it
Step: 1
To calculate the ratios for Home Depot for the fiscal years ending January 30 2022 and January 31 2021 we need the following information from the financial statements Inventory Turnover Inventory Turn...
Get Instant Access to Expert-Tailored Solutions
See step-by-step solutions with expert insights and AI powered tools for academic success
Step: 2

Step: 3

Ace Your Homework with AI
Get the answers you need in no time with our AI-driven, step-by-step assistance
Get Started


