

Question
Based on the findings shown in Table 3: Looking at the 95% confidence interval for the estimated unadjusted mean BMI between group difference in change
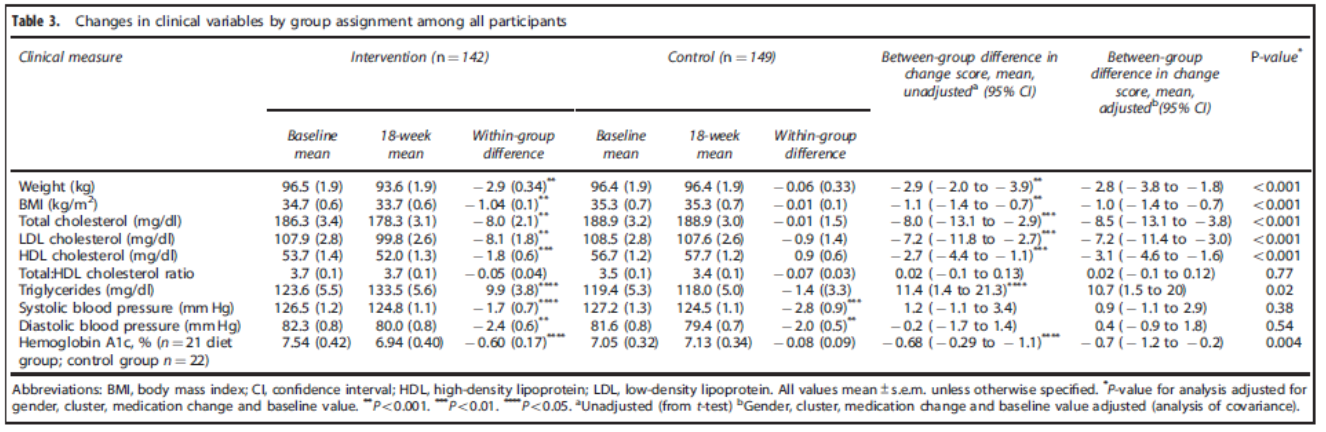
Based on the findings shown in Table 3: Looking at the 95% confidence interval for the estimated unadjusted mean BMI "between group difference in change score", do you think the estimated difference in change score (-1.1 kg/m2) was a statistically significant change?
Please circle one of the following options:YesNoNotspecified
Please explain your answer:
?
Step by Step Solution
There are 3 Steps involved in it
Step: 1

Get Instant Access to Expert-Tailored Solutions
See step-by-step solutions with expert insights and AI powered tools for academic success
Step: 2

Step: 3
Ace Your Homework with AI
Get the answers you need in no time with our AI-driven, step-by-step assistance
Get Started
Algebra 2
Authors: Randall I. Charles, Basia Hall, Dan Kennedy, Laurie E Bass
Student Edition
0133500438, 978-0133500431