

Answered step by step
Verified Expert Solution
Question
1 Approved Answer
Based on the following scenarios suggest the recommendation you would make in terms of specific financial instruments to the maple syrup company and give reasons
- Based on the following scenarios suggest the recommendation you would make in terms of specific financial instruments to the maple syrup company and give reasons for your recommendations?
- Develop a trading strategy for the maple syrup company based on the 3 year financial statements that you have examined for the maple syrup company ( what financial instruments would you recommend for this company based upon the analysis and research you have conducted above). Be sure to provide a motivation for the recommendations you make
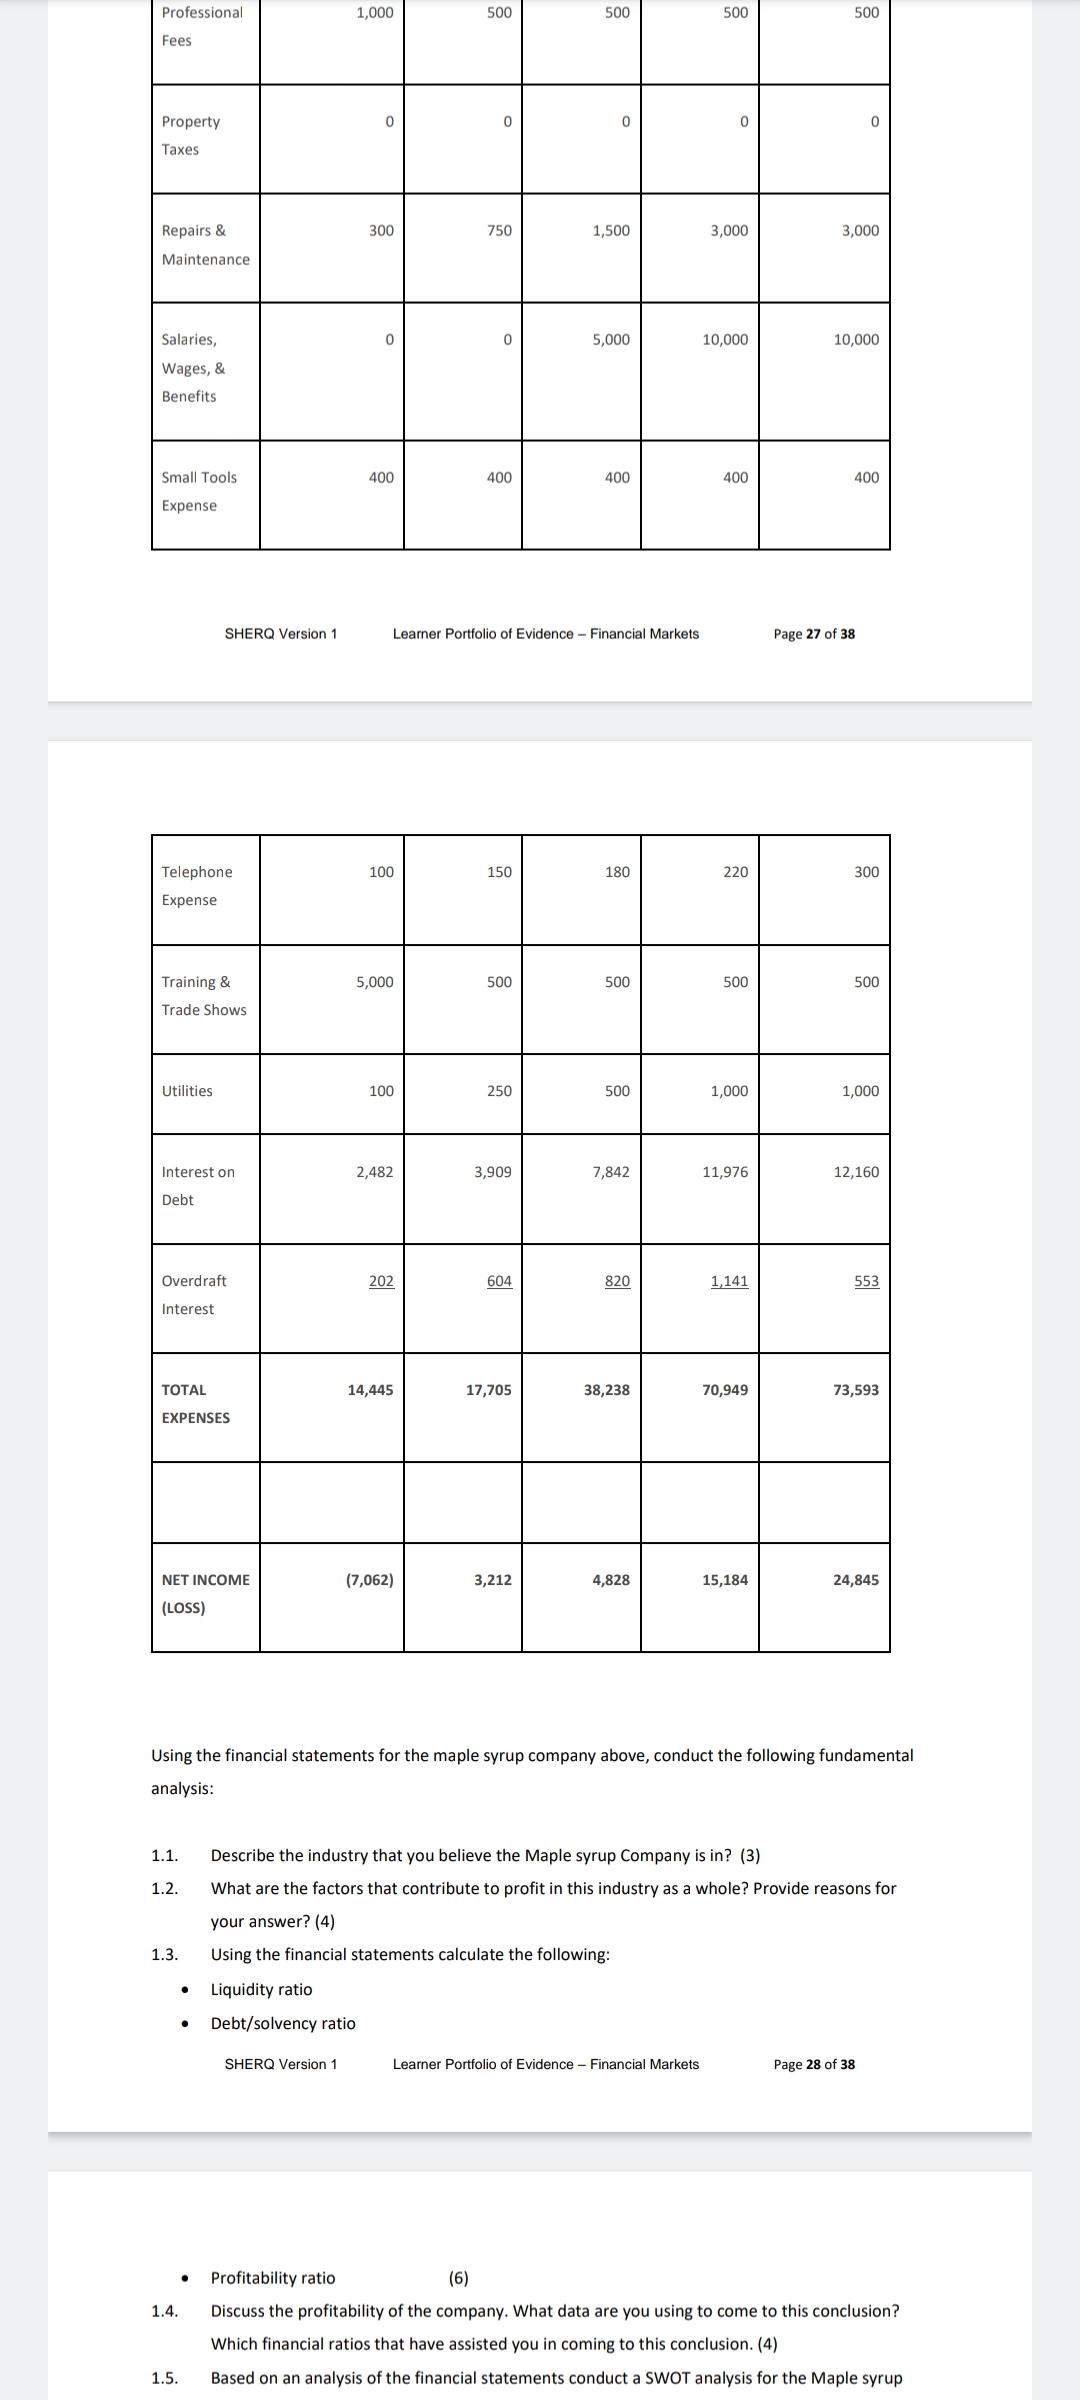
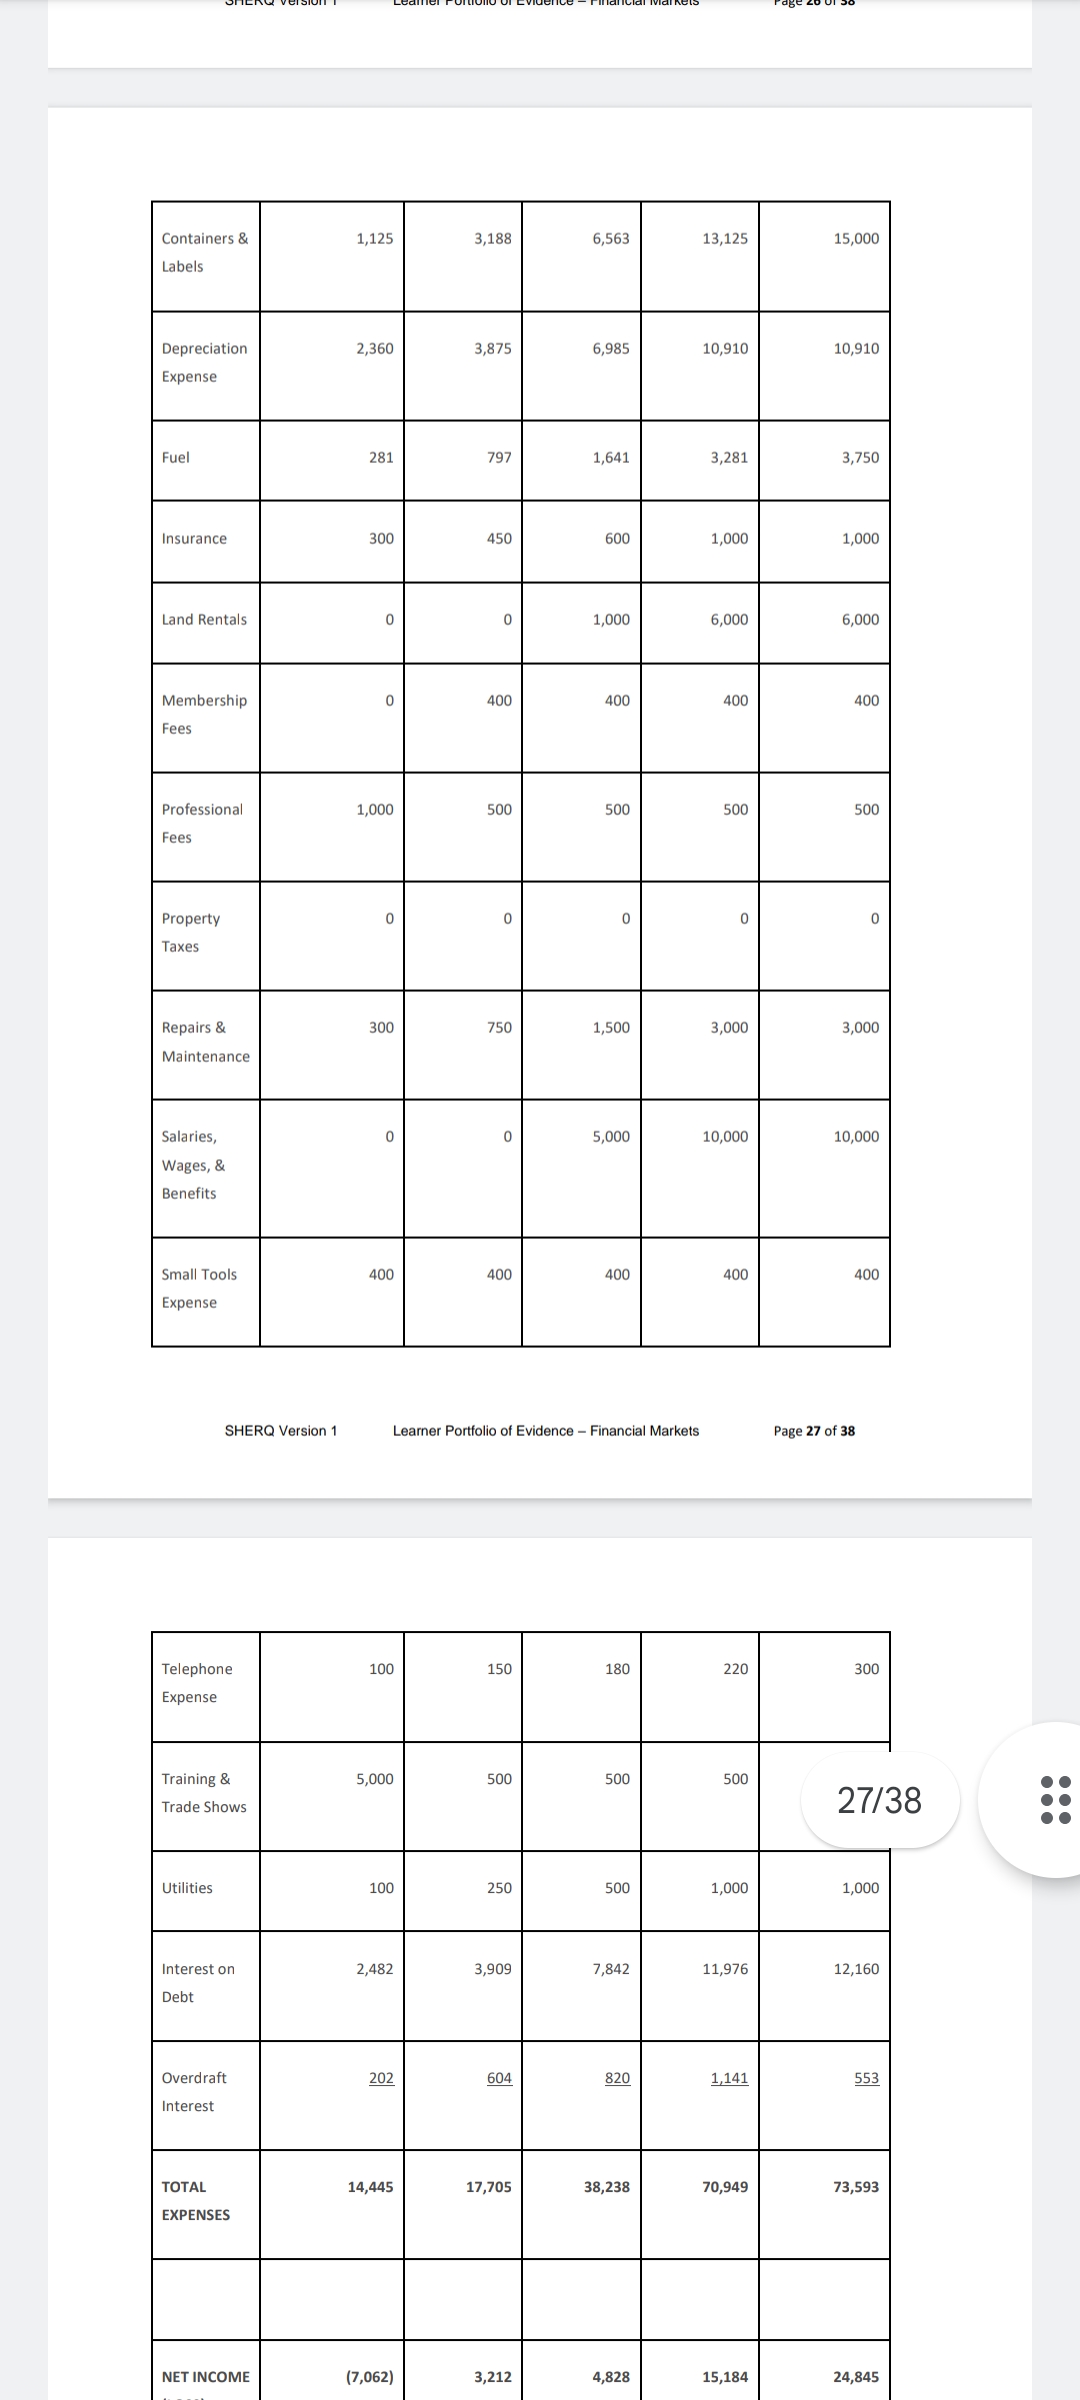
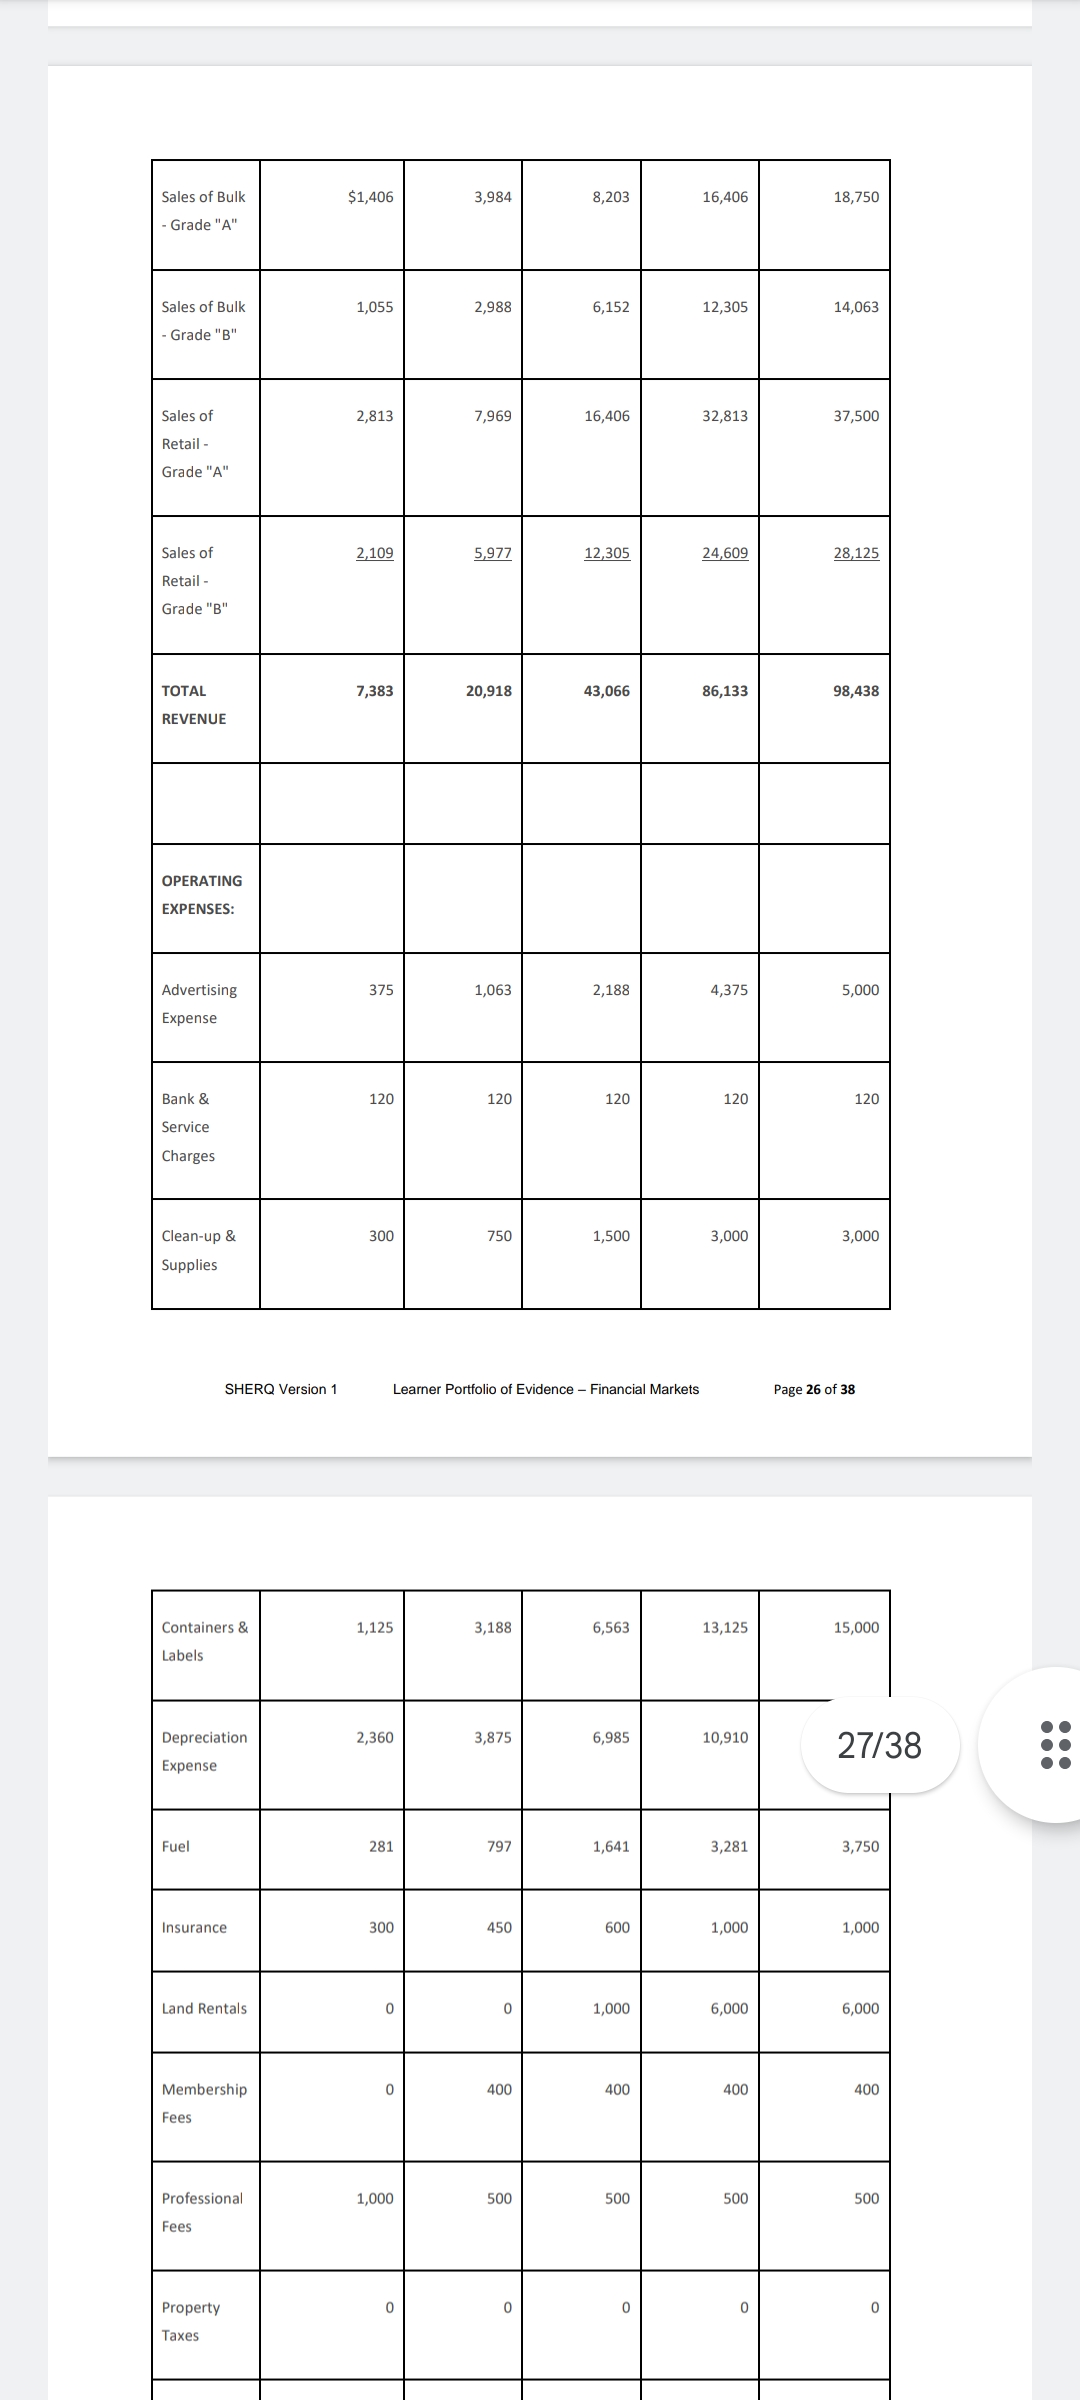
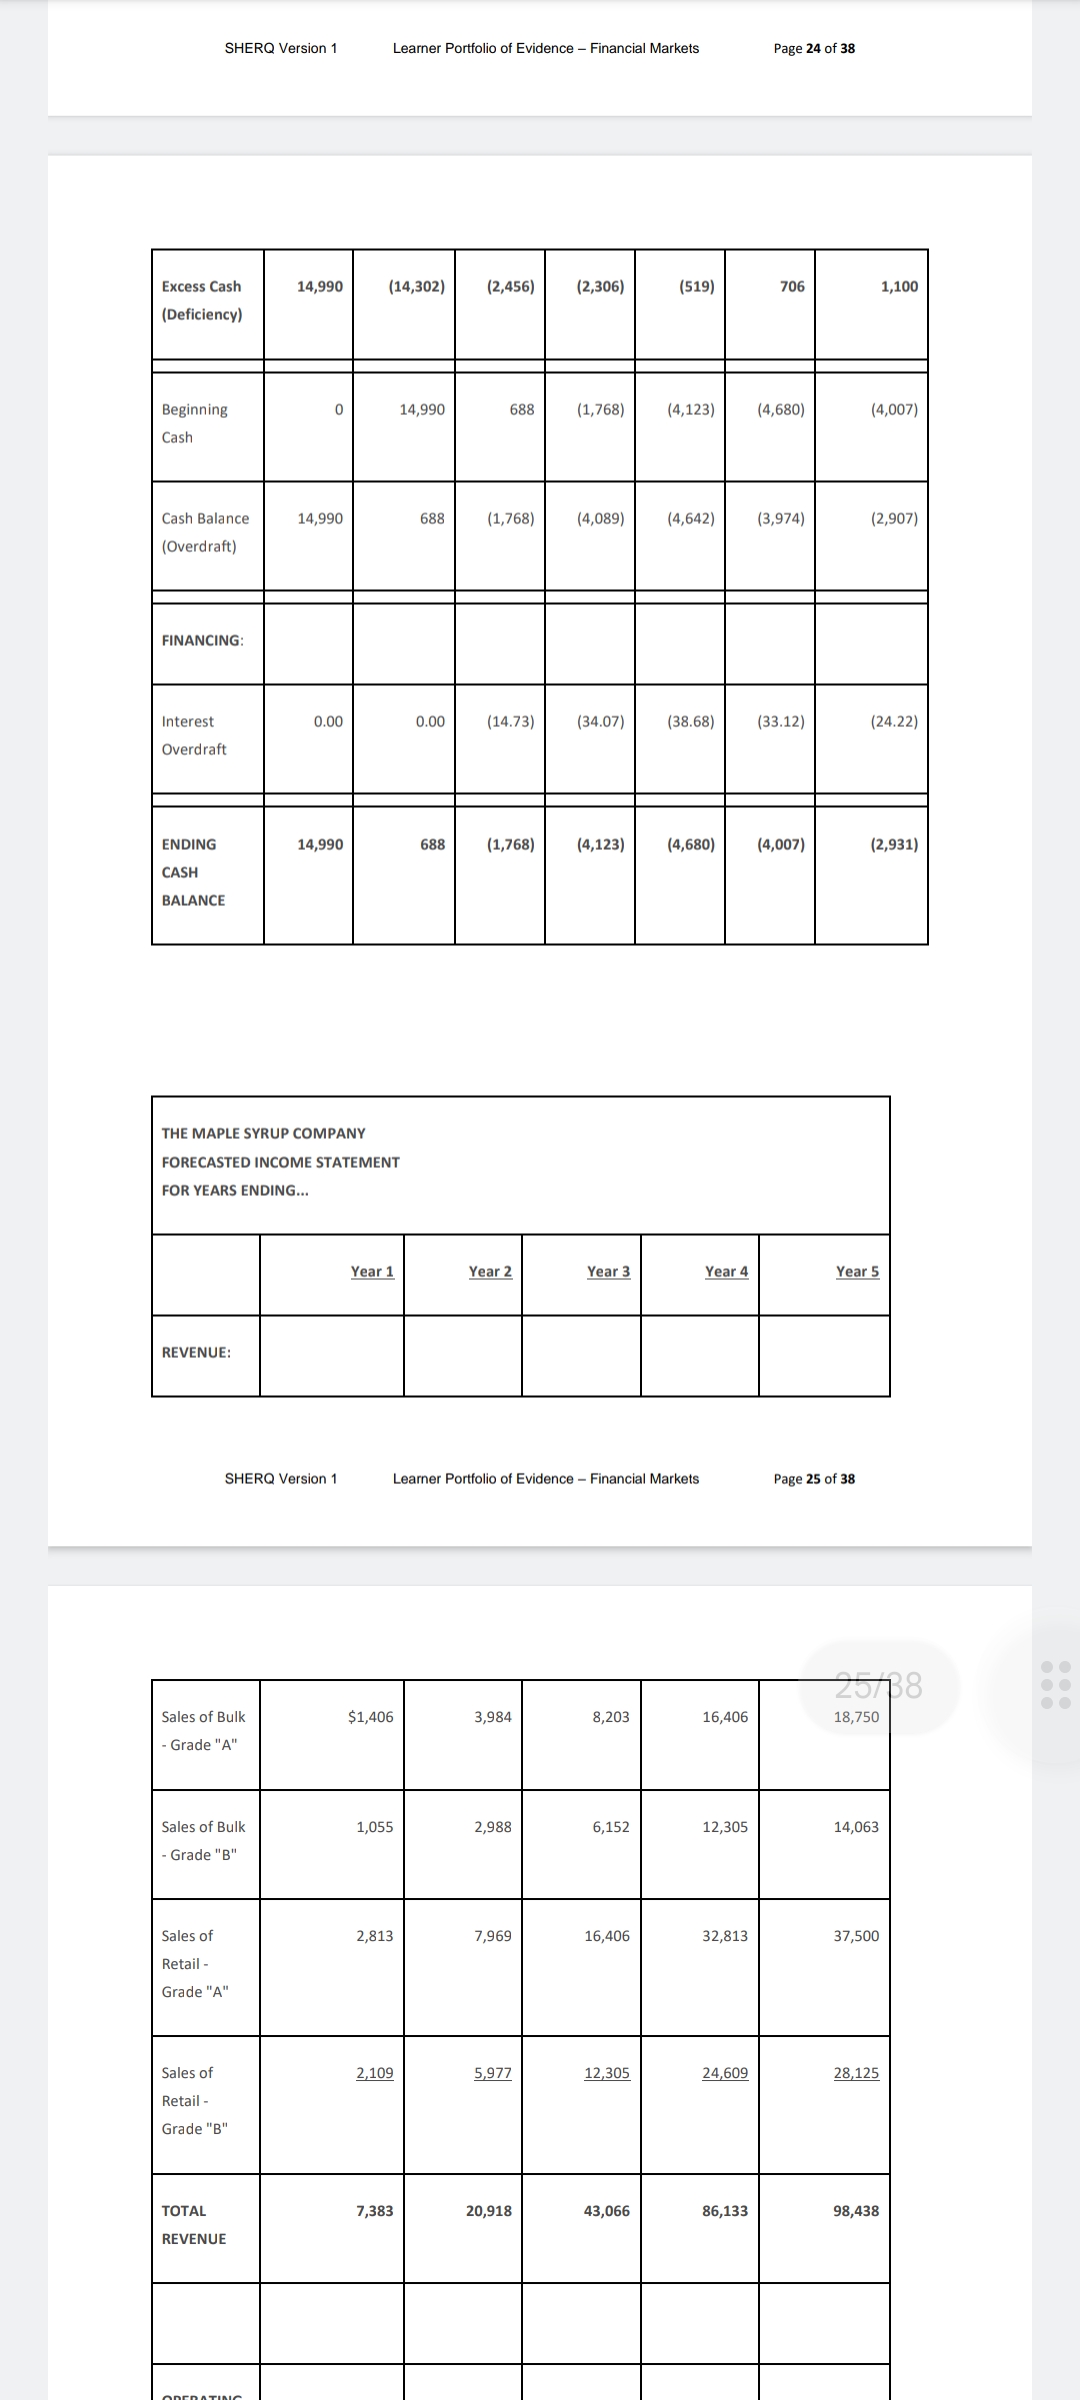
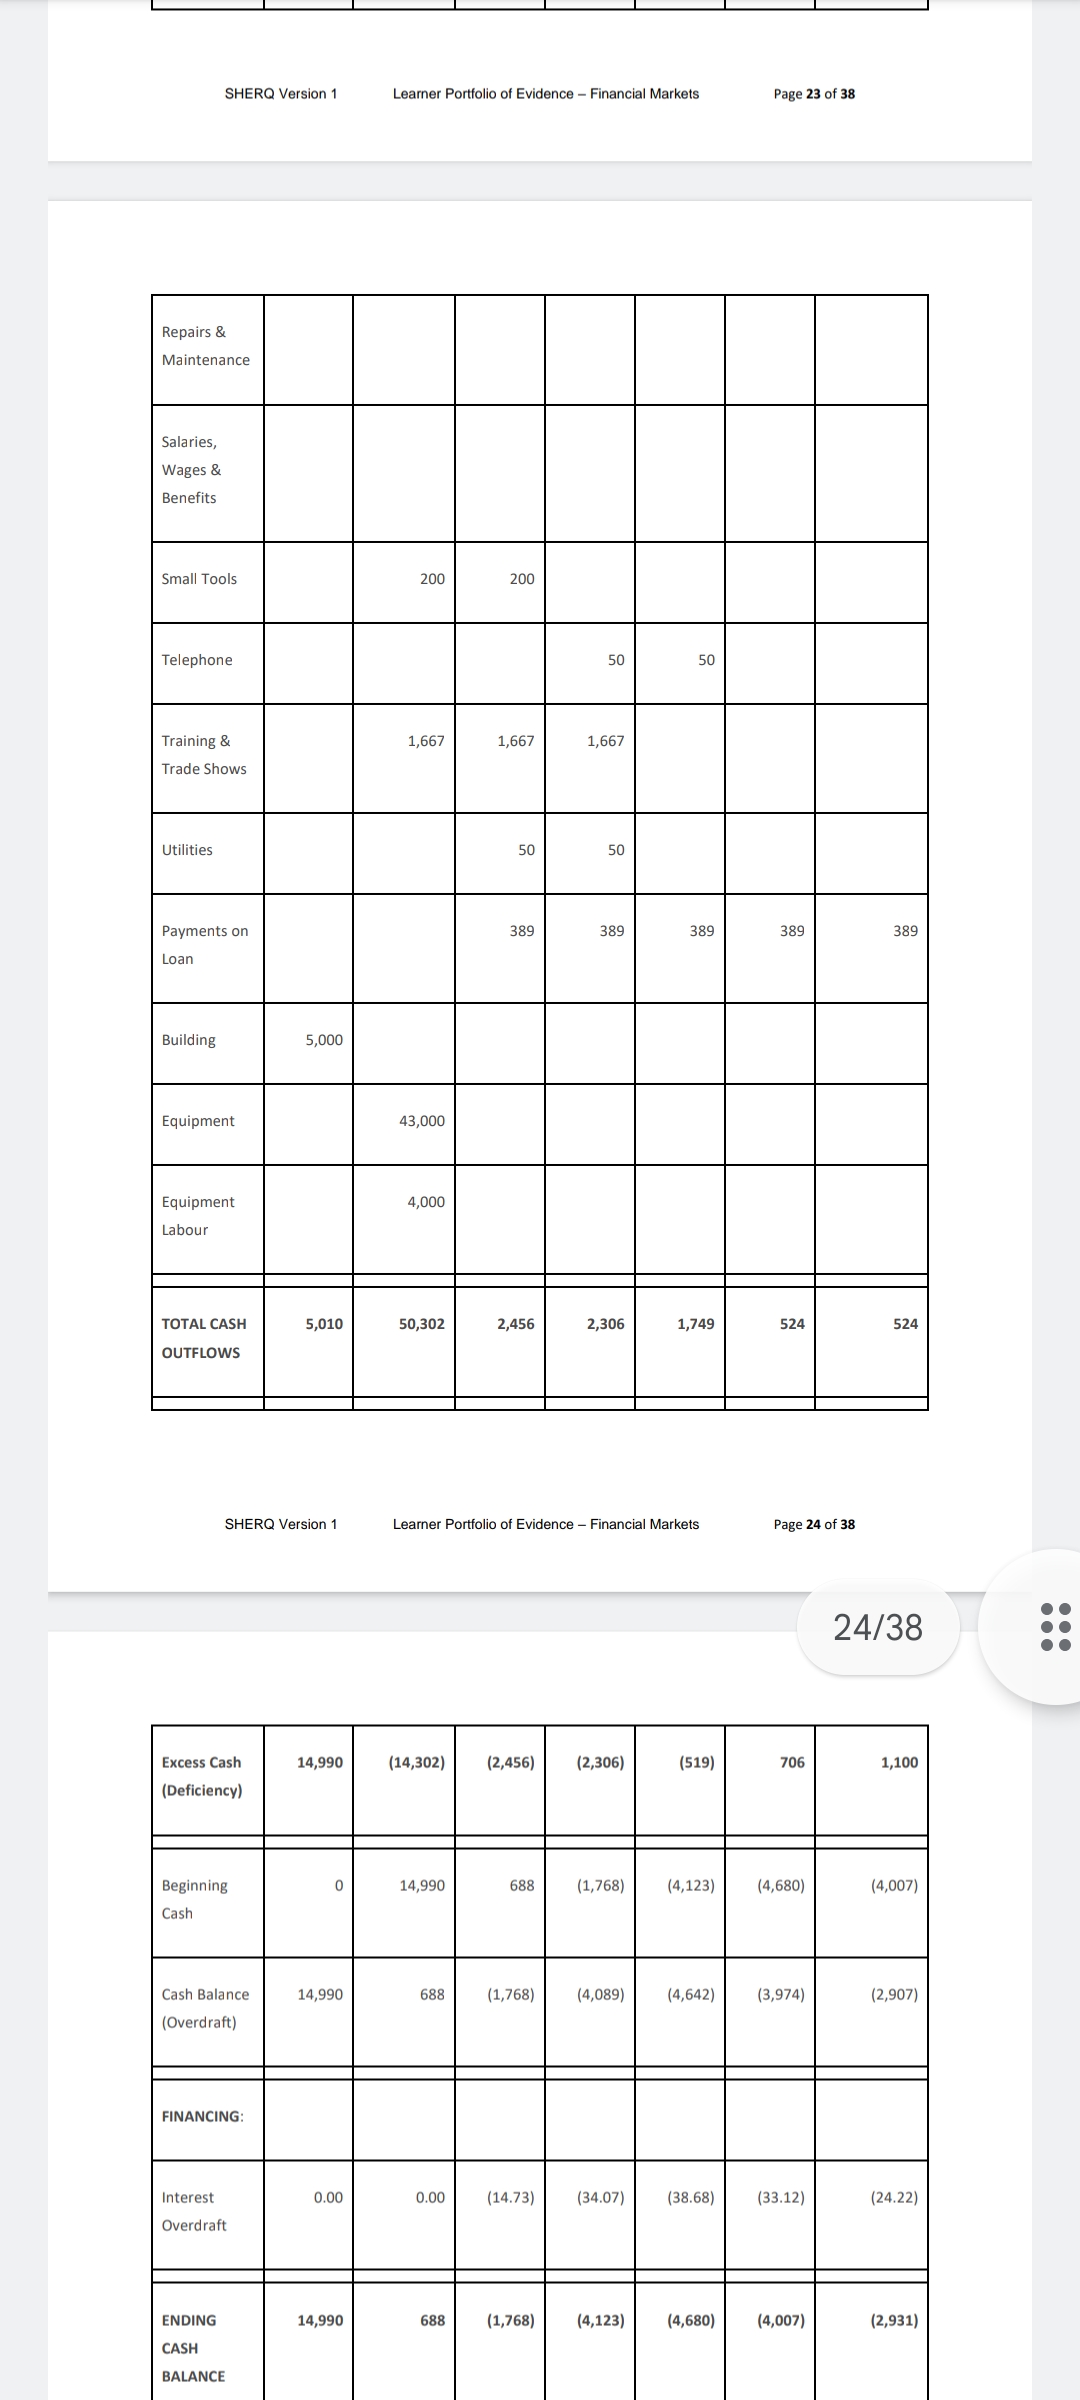
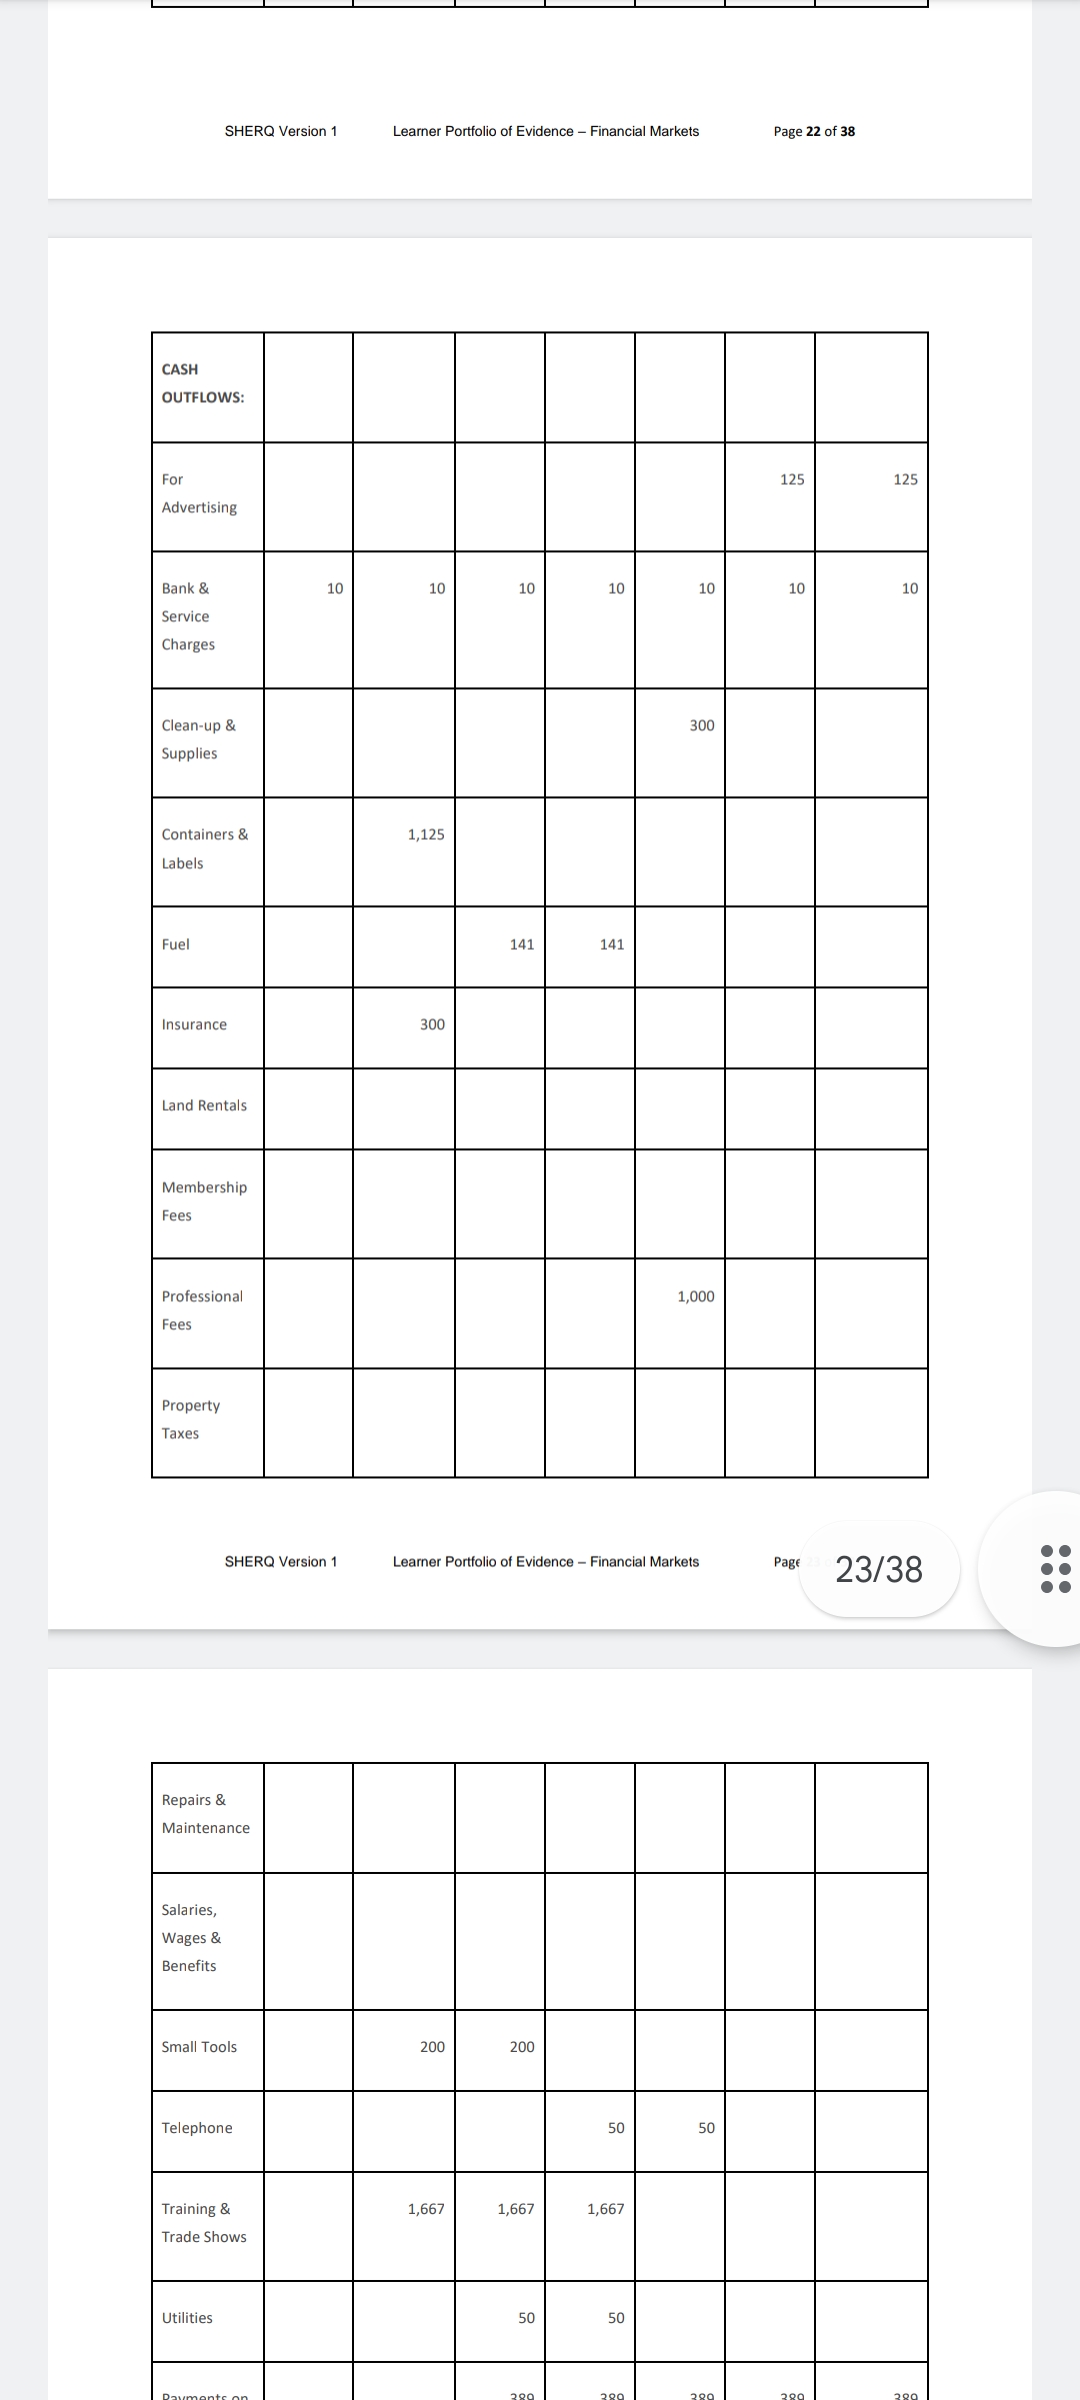
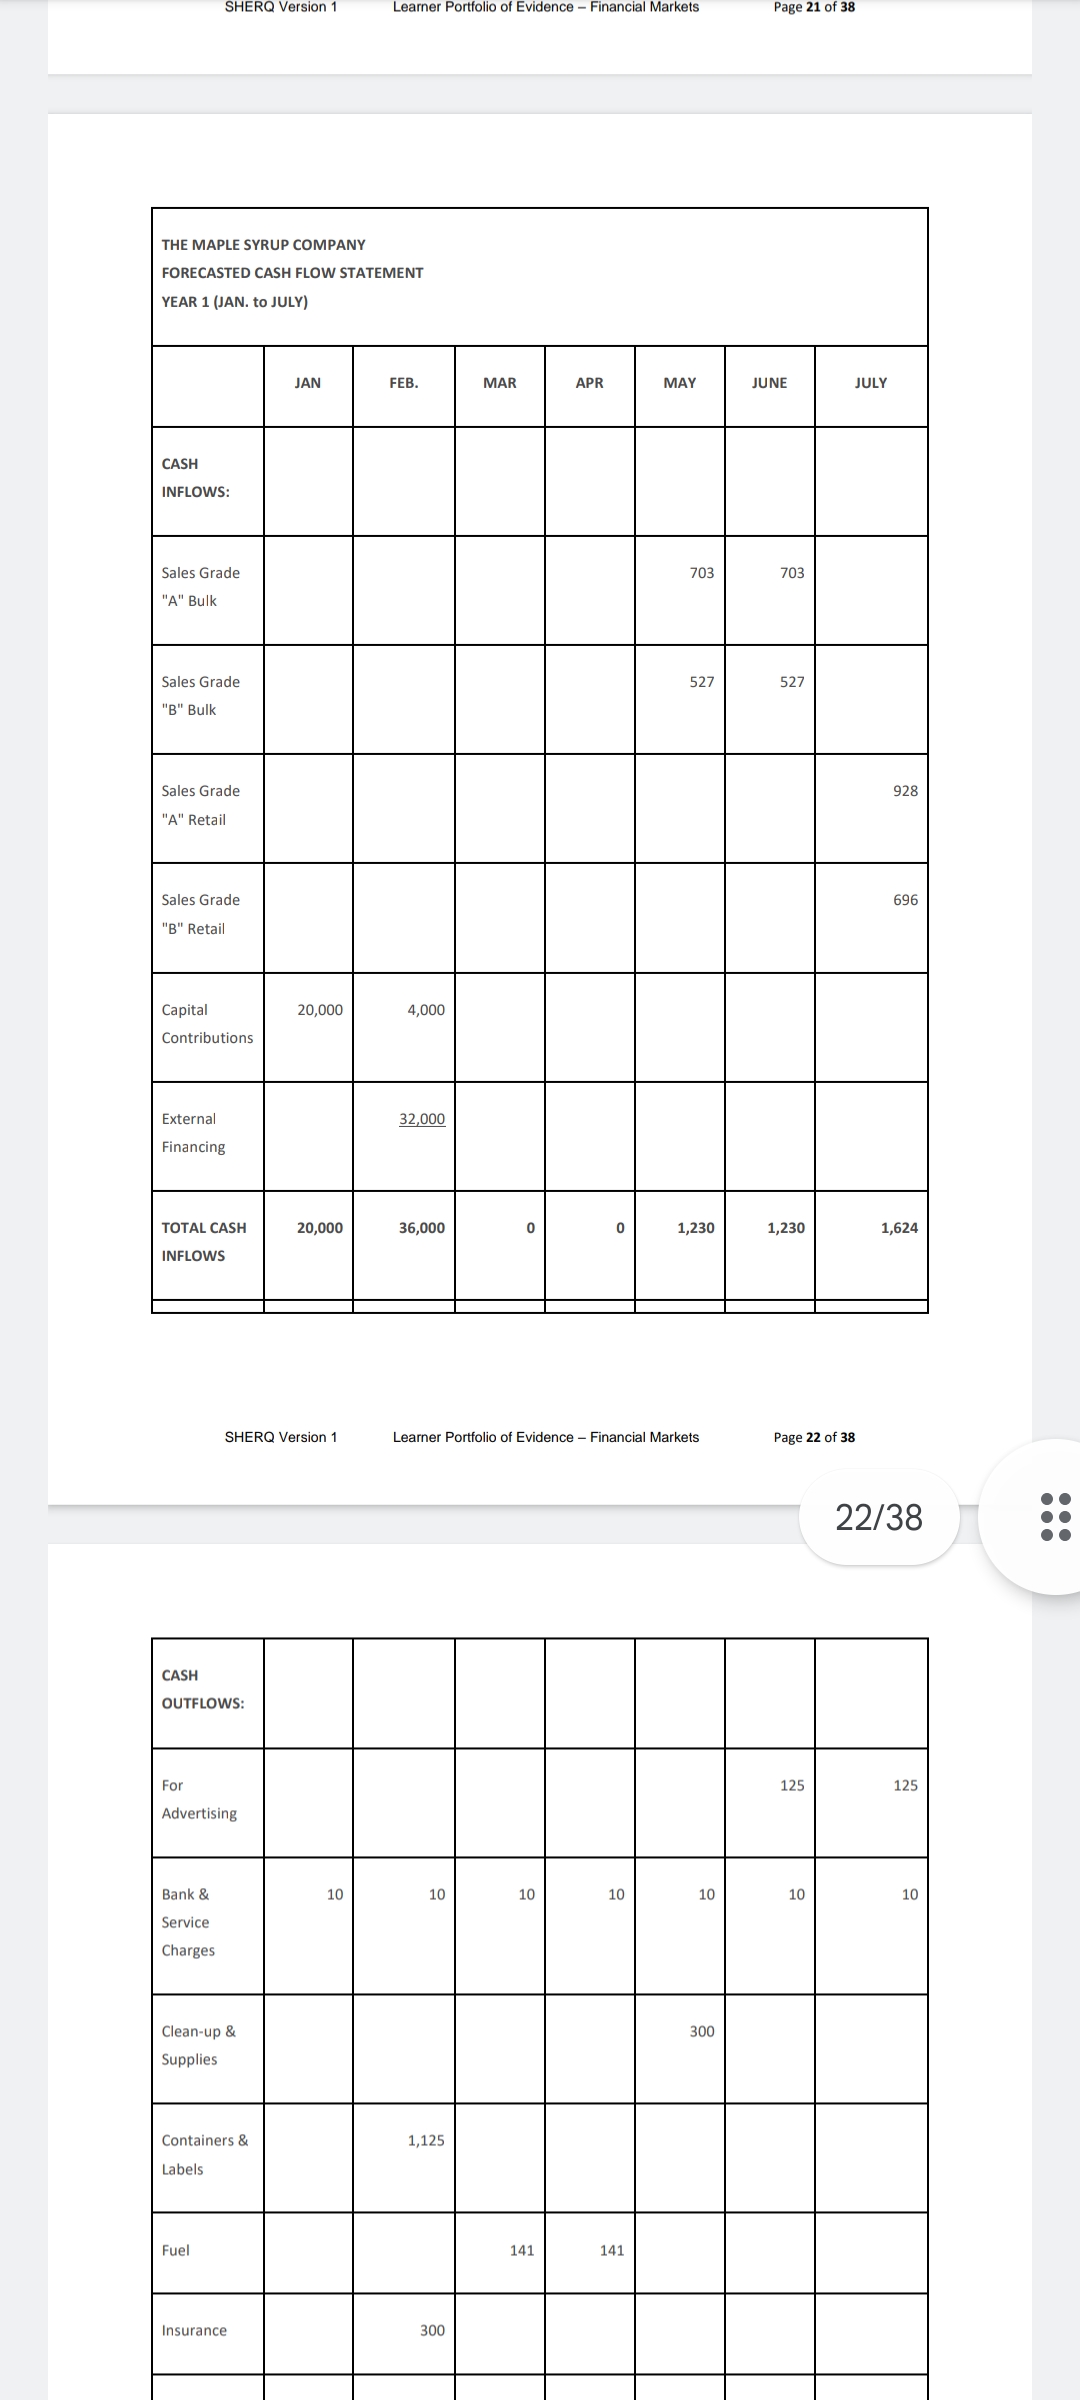
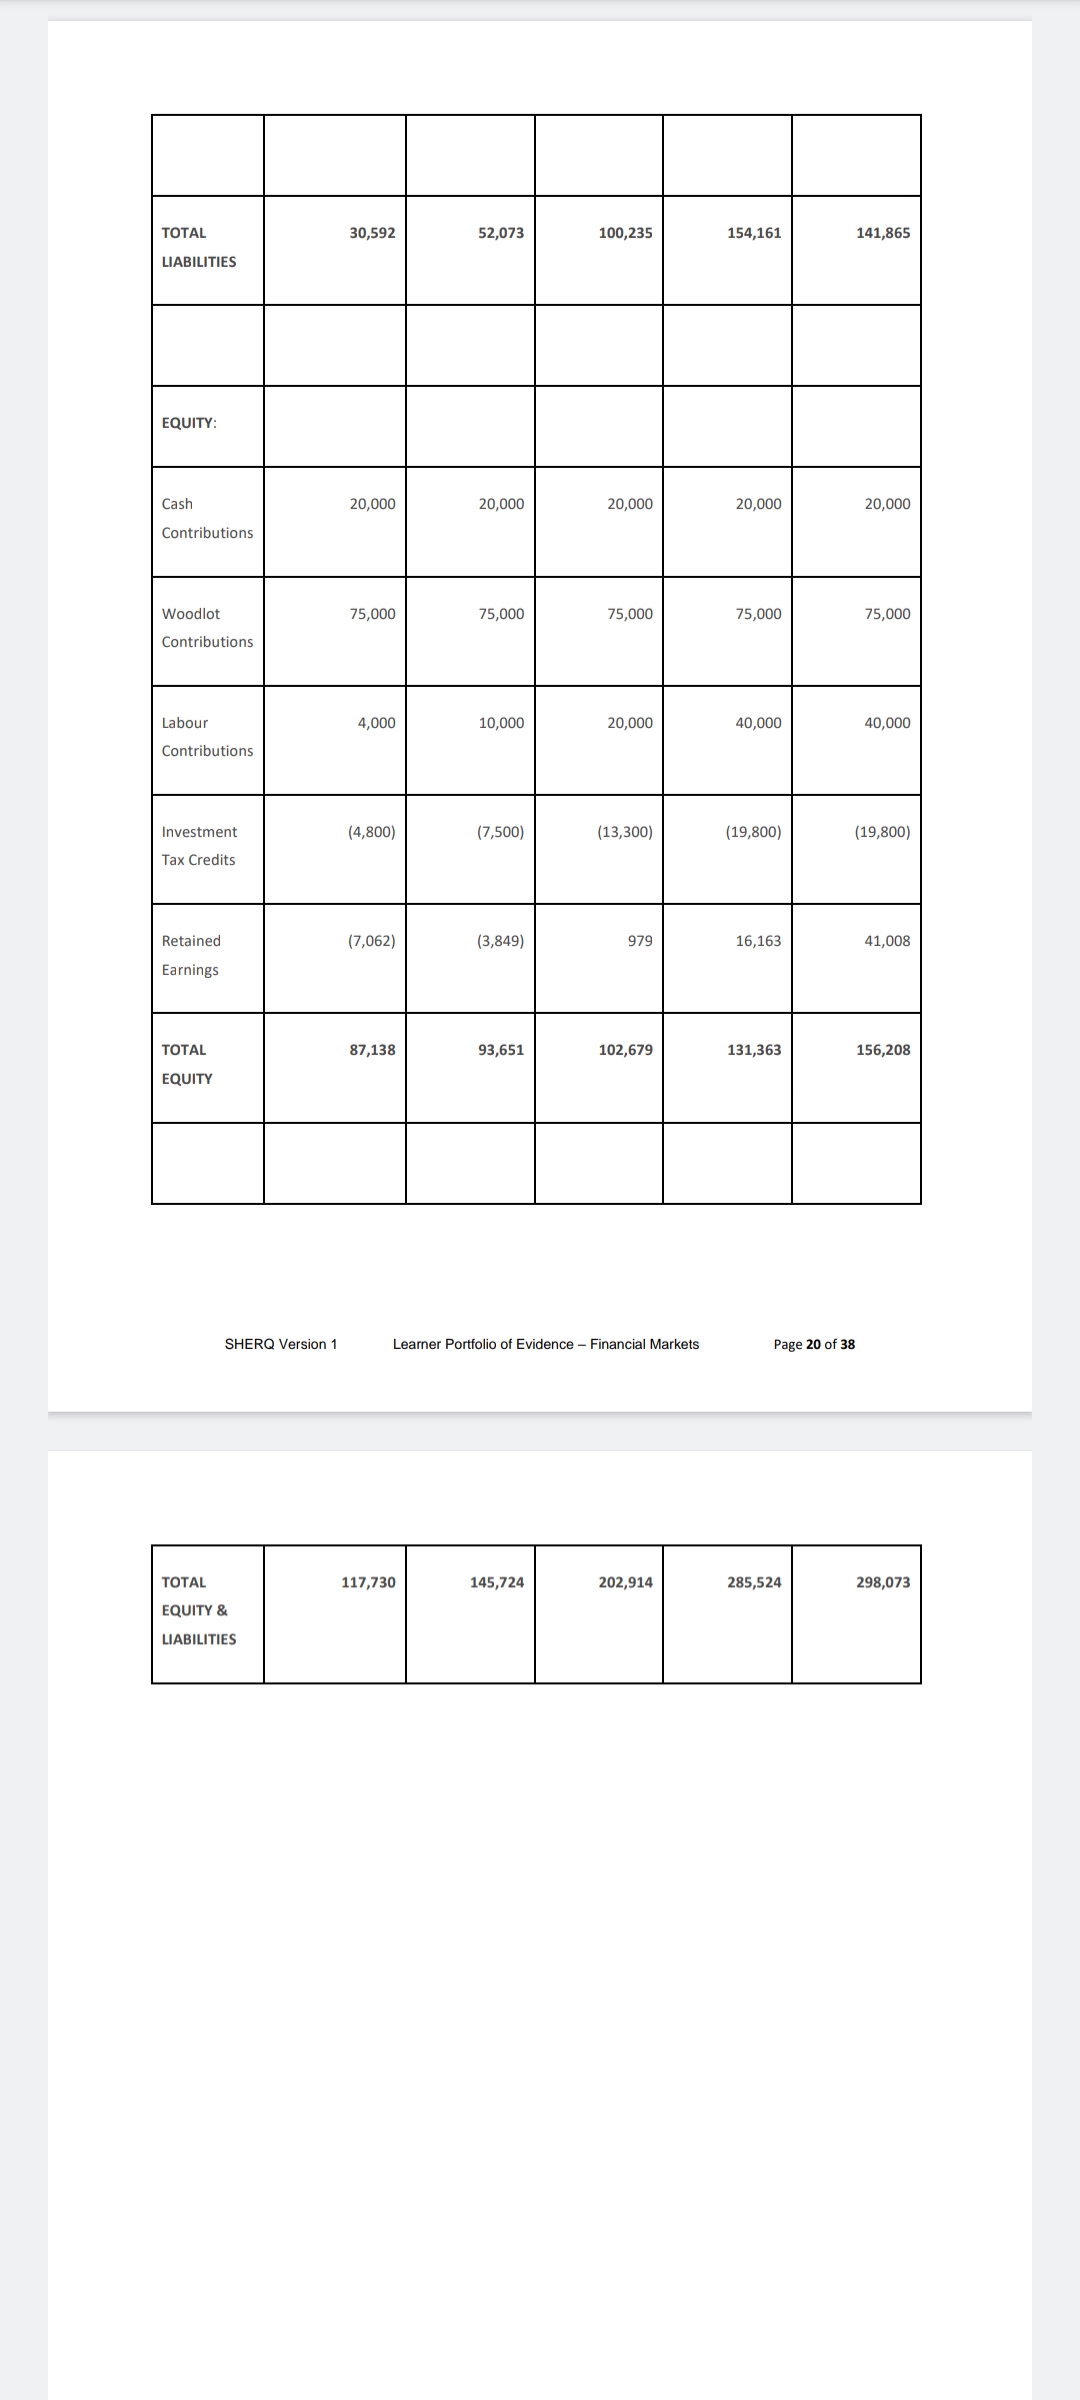
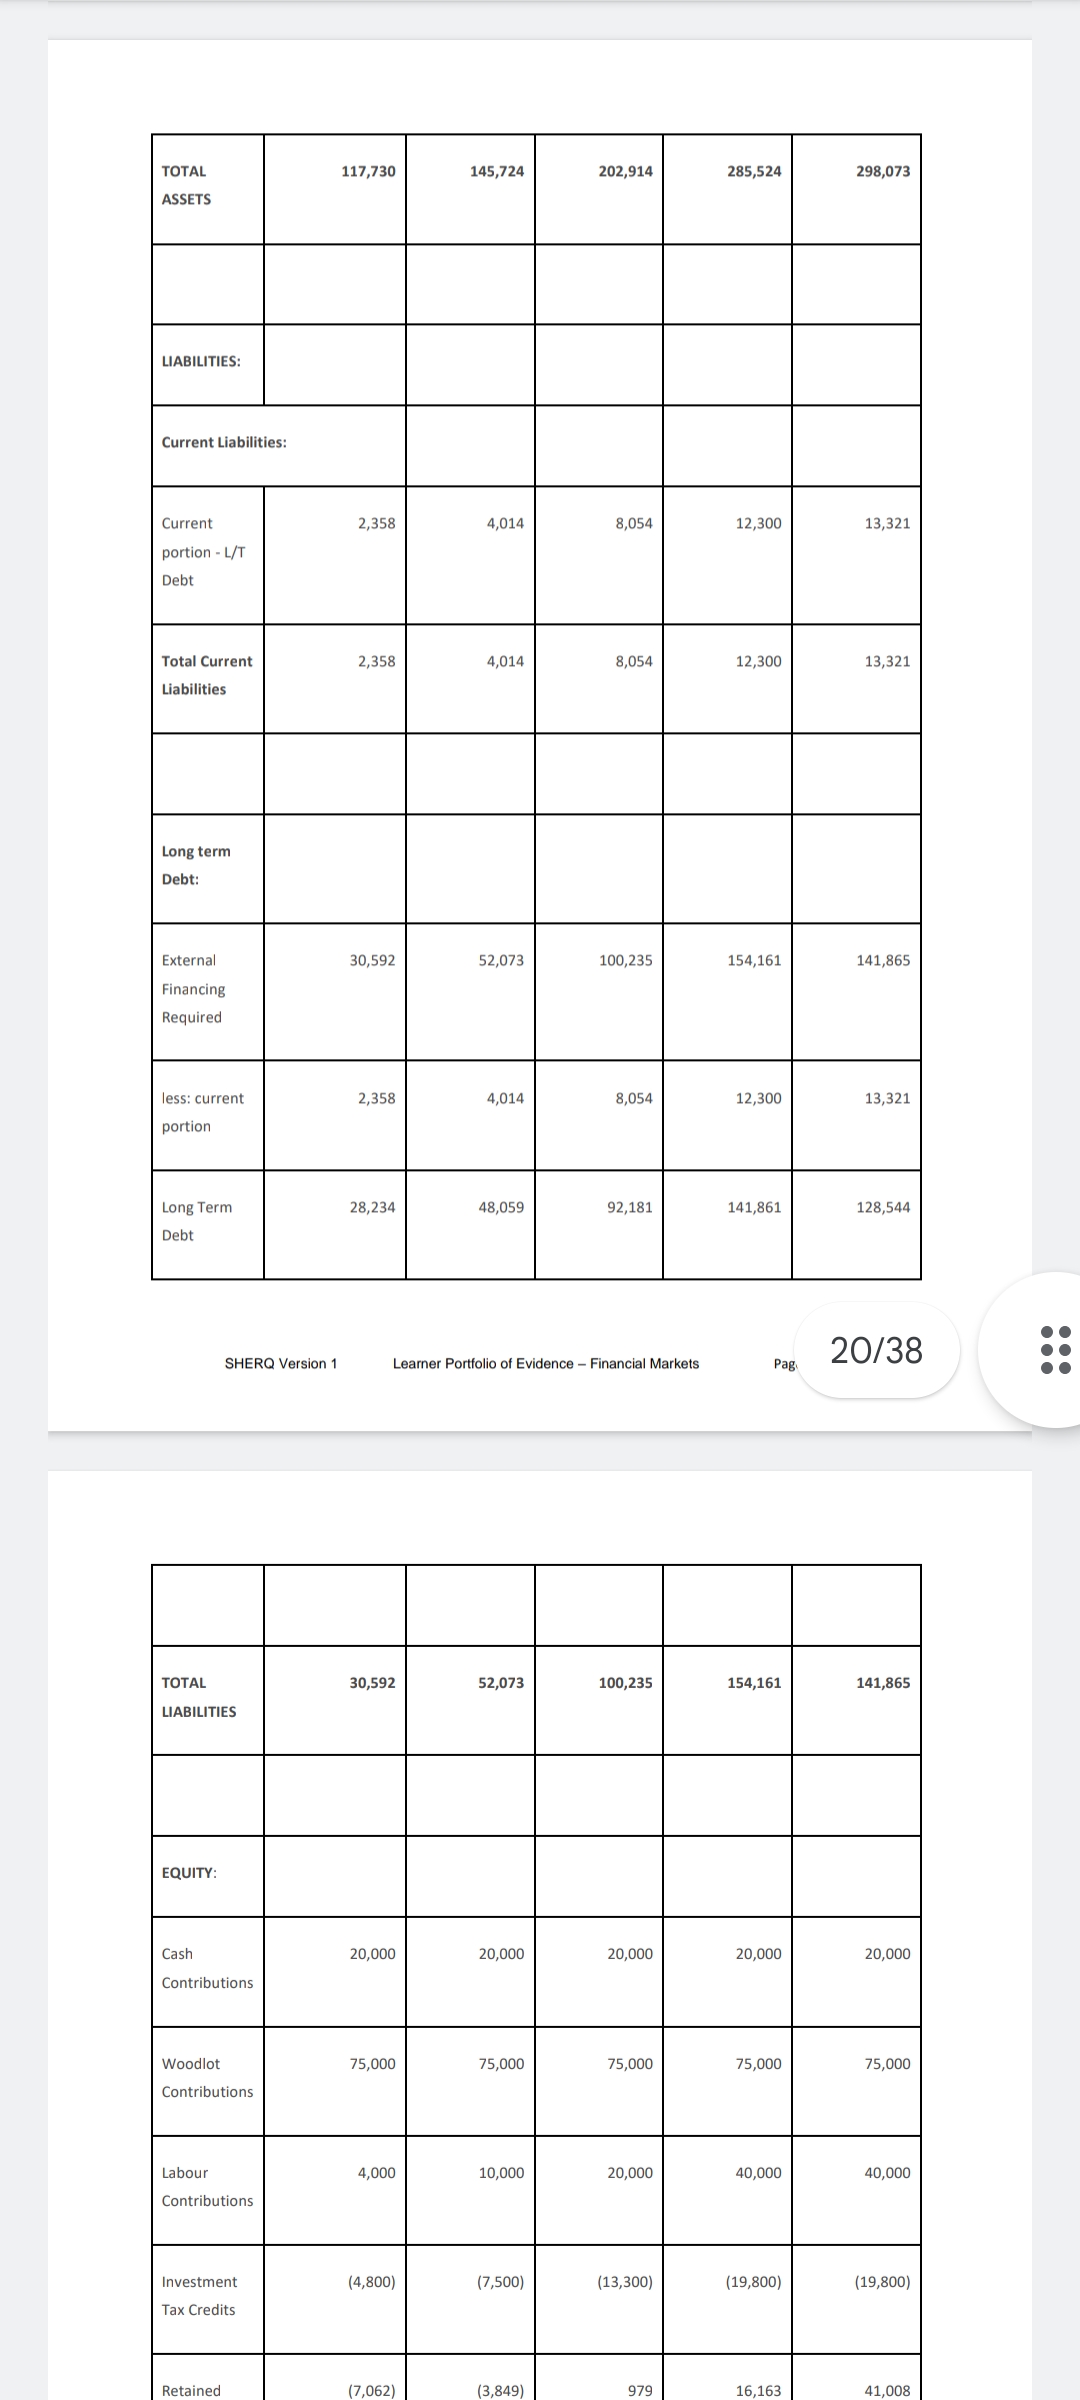
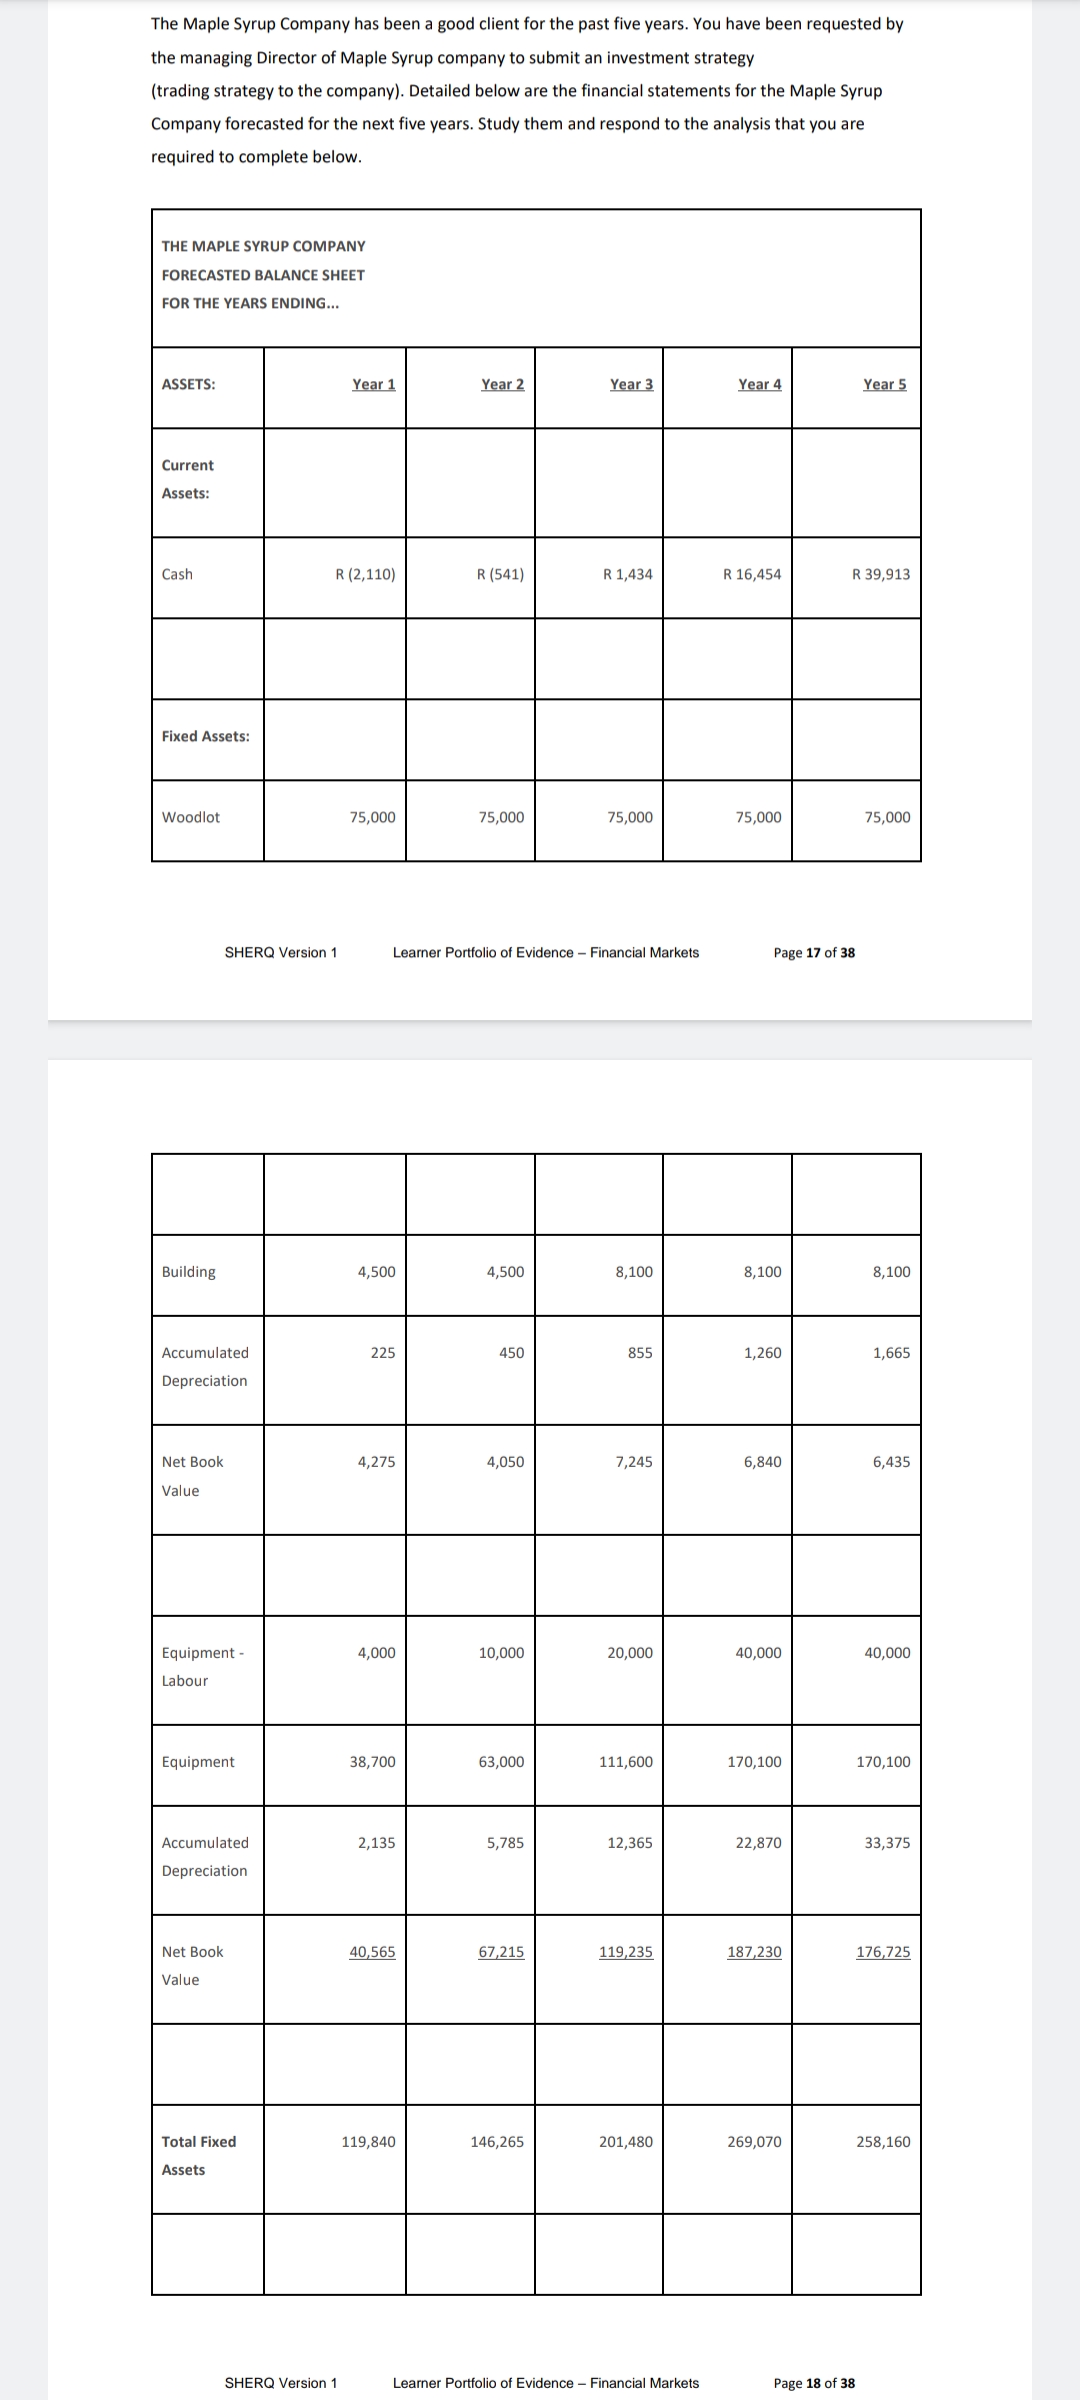 SHERQ Version 1 Learner Portfolio of Evidence - Financial Markets Page 24 of 38 \begin{tabular}{|l|r|r|r|r|r|r|r|} \hline \begin{tabular}{l} Excess Cash \\ (Deficiency) \end{tabular} & 14,990 & (14,302) & (2,456) & (2,306) & (519) & 706 & 1,100 \\ \hline \begin{tabular}{l} Beginning \\ Cash \end{tabular} & 0 & 14,990 & 688 & (1,768) & (4,123) & (4,680) & (4,007) \\ \hline \begin{tabular}{l} Cash Balance \\ (Overdraft) \end{tabular} & 14,990 & 688 & (1,768) & (4,089) & (4,642) & (3,974) & (2,907) \\ \hline \begin{tabular}{l} FINANCING: \\ Interest \\ Overdraft \end{tabular} & 0.00 & 0.00 & (14.73) & (34.07) & (38.68) & (33.12) & \\ \hline \begin{tabular}{l} BALANCE \\ CASH \end{tabular} & & & & & & & \\ \hline \end{tabular} \begin{tabular}{|c|c|c|c|c|c|} \hline \multicolumn{6}{|c|}{\begin{tabular}{l} THE MAPLE SYRUP COMPANY \\ FORECASTED INCOME STATEMENT \\ FOR YEARS ENDING... \end{tabular}} \\ \hline & Year 1 & Year 2 & Year 3 & Year 4 & Year 5 \\ \hline REVENUE: & & & & & \\ \hline \end{tabular} SHERQ Version 1 Learner Porttolio of Evidence - Financial Markets Page 25 of 38 \begin{tabular}{|l|r|r|r|r|r|} \hline \begin{tabular}{l} Sales of Bulk \\ - Grade "A" \end{tabular} & $1,406 & 3,984 & 8,203 & 16,406 & 18,750 \\ \hline \begin{tabular}{l} Sales of Bulk \\ - Grade "B" \end{tabular} & 1,055 & 2,988 & 6,152 & 12,305 & 14,063 \\ \hline \begin{tabular}{l} Sales of \\ Retail - \\ Grade "A" \end{tabular} & 2,813 & 7,969 & 16,406 & 32,813 & 37,500 \\ \hline \begin{tabular}{l} Sales of \\ Retail - \\ Grade "B" \end{tabular} & 2,109 & 5,977 & 12,305 & 24,609 & \\ \hline \begin{tabular}{l} TOTAL \\ REVENUE \end{tabular} & 7,383 & 20,918 & 43,066 & 86,133 & \\ \hline \end{tabular} Using the financial statements for the maple syrup company above, conduct the following fundamental analysis: 1.1. Describe the industry that you believe the Maple syrup Company is in? (3) 1.2. What are the factors that contribute to profit in this industry as a whole? Provide reasons for your answer? (4) 1.3. Using the financial statements calculate the following: - Liquidity ratio - Debt/solvency ratio SHERQ Version 1 Learner Portfolio of Evidence - Financial Markets Page 28 of 38 - Profitability ratio (6) 1.4. Discuss the profitability of the company. What data are you using to come to this conclusion? Which financial ratios that have assisted you in coming to this conclusion. (4) 1.5. Based on an analysis of the financial statements conduct a SWOT analysis for the Maple syrup \begin{tabular}{|c|c|c|c|c|c|} \hline \begin{tabular}{l} Sales of Bulk \\ - Grade "A" \end{tabular} & $1,406 & 3,984 & 8,203 & 16,406 & 18,750 \\ \hline \begin{tabular}{l} Sales of Bulk \\ - Grade "B" \end{tabular} & 1,055 & 2,988 & 6,152 & 12,305 & \begin{tabular}{l} 14,063 \\ \end{tabular} \\ \hline \begin{tabular}{l} Sales of \\ Retail - \\ Grade "A" \end{tabular} & 2,813 & 7,969 & 16,406 & 32,813 & 37,500 \\ \hline \begin{tabular}{l} Sales of \\ Retail - \\ Grade "B" \end{tabular} & 2,109 & 5,977 & 12,305 & 24,609 & 28,125 \\ \hline \begin{tabular}{l} TOTAL \\ REVENUE \end{tabular} & 7,383 & 20,918 & 43,066 & 86,133 & 98,438 \\ \hline \begin{tabular}{l} OPERATING \\ EXPENSES: \end{tabular} & & & & & \\ \hline \begin{tabular}{l} Advertising \\ Expense \end{tabular} & 375 & 1,063 & 2,188 & 4,375 & 5,000 \\ \hline \begin{tabular}{l} Bank \& \\ Service \\ Charges \end{tabular} & 120 & 120 & 120 & 120 & 120 \\ \hline \begin{tabular}{l} Clean-up \& \\ Supplies \end{tabular} & 300 & 750 & 1,500 & 3,000 & 3,000 \\ \hline \end{tabular} SHERQ Version 1 Learner Porttolio of Evidence - Financial Markets Page 26 of 38 \begin{tabular}{|l|r|r|r|r|r|} \hline \begin{tabular}{l} Containers \& \\ Labels \end{tabular} & 1,125 & 3,188 & 6,563 & 13,125 & 15,000 \\ \hline \begin{tabular}{l} Depreciation \\ Expense \end{tabular} & 2,360 & 3,875 & 6,985 & 10,910 & 27/38 \\ \hline Fuel & 281 & 797 & 1,641 & 3,281 & 3,750 \\ \hline Insurance & 300 & 450 & 600 & 1,000 & 1,000 \\ \hline Land Rentals & 0 & 0 & 1,000 & 6,000 & 6,000 \\ \hline \begin{tabular}{l} Membership \\ Fees \end{tabular} & 0 & 400 & 400 & 400 & 400 \\ \hline \begin{tabular}{l} Professional \\ Fees \end{tabular} & 1,000 & 500 & 500 & 500 & 500 \\ \hline \begin{tabular}{l} Property \\ Taxes \end{tabular} & 0 & & & & \\ \hline \end{tabular} SHERQ Version 1 Learner Portfolio of Evidence - Financial Markets Page 23 of 38 \begin{tabular}{|c|c|c|c|c|c|c|c|} \hline \begin{tabular}{l} Repairs \& \\ Maintenance \end{tabular} & & & & & & & \\ \hline \begin{tabular}{l} Salaries, \\ Wages \& \\ Benefits \end{tabular} & & & & & & & \\ \hline Small Tools & & 200 & 200 & & & & \\ \hline Telephone & & & & 50 & 50 & & \\ \hline \begin{tabular}{l} Training \& \\ Trade Shows \end{tabular} & & 1,667 & 1,667 & 1,667 & & & \\ \hline Utilities & & & 50 & 50 & & & \\ \hline \begin{tabular}{l} Payments on \\ Loan \end{tabular} & & & 389 & 389 & 389 & 389 & 389 \\ \hline Building & 5,000 & & & & & & \\ \hline Equipment & & 43,000 & & & & & \\ \hline \begin{tabular}{l} Equipment \\ Labour \end{tabular} & & 4,000 & & & & & \\ \hline \begin{tabular}{l} TOTAL CASH \\ OUTFLOWS \end{tabular} & 5,010 & 50,302 & 2,456 & 2,306 & 1,749 & 524 & 524 \\ \hline \end{tabular} SHERQ Version 1 Learner Portfolio of Evidence - Financial Markets Page 24 of 38 24/38 \begin{tabular}{|l|r|r|r|r|r|r|r|} \hline \begin{tabular}{l} Excess Cash \\ (Deficiency) \end{tabular} & 14,990 & (14,302) & (2,456) & (2,306) & (519) & 706 & 1,100 \\ \hline \begin{tabular}{l} Beginning \\ Cash \end{tabular} & 0 & 14,990 & 688 & (1,768) & (4,123) & (4,680) & (4,007) \\ \hline \begin{tabular}{l} Cash Balance \\ (Overdraft) \end{tabular} & 14,990 & 688 & (1,768) & (4,089) & (4,642) & (3,974) & (2,907) \\ \hline \begin{tabular}{l} FINANCING: \\ Interest \\ Overdraft \end{tabular} & 0.00 & 0.00 & (14.73) & (34.07) & (38.68) & (33.12) & (24.22) \\ \hline \begin{tabular}{l} ENDING \\ CASH \\ BALANCE \end{tabular} & 14,990 & 688 & (1,768) & (4,123) & (4,680) & (4,007) & \\ \hline \end{tabular} \begin{tabular}{|c|c|c|c|c|c|} \hline \begin{tabular}{|l} TOTAL \\ LABILITIES \end{tabular} & 30,592 & 52,073 & 100,235 & 154,161 & 141,865 \\ \hline EQUITY: & & & & & \\ \hline \begin{tabular}{l} Cash \\ Contributions \end{tabular} & 20,000 & 20,000 & 20,000 & 20,000 & 20,000 \\ \hline \begin{tabular}{l} Woodlot \\ Contributions \end{tabular} & 75,000 & 75,000 & 75,000 & 75,000 & 75,000 \\ \hline \begin{tabular}{|l} Labour \\ Contributions \end{tabular} & 4,000 & 10,000 & 20,000 & 40,000 & 40,000 \\ \hline \begin{tabular}{|l|} Investment \\ Tax Credits \end{tabular} & (4,800) & (7,500) & (13,300) & (19,800) & (19,800) \\ \hline \begin{tabular}{l} Retained \\ Earnings \end{tabular} & (7,062) & (3,849) & 979 & 16,163 & 41,008 \\ \hline \begin{tabular}{|l|} TOTAL \\ EQUITY \end{tabular} & 87,138 & 93,651 & 102,679 & 131,363 & 156,208 \\ \hline & & & & & \\ \hline \end{tabular} SHERQ Version 1 Learner Portfolio of Evidence - Financial Markets Page 20 of 38 \begin{tabular}{|l|r|r|r|r|r|} \hline \begin{tabular}{l} TOTAL \\ EQUITY \& \\ LIABILITIES \end{tabular} & 117,730 & 145,724 & 202,914 & 285,524 & 298,073 \\ \hline \end{tabular} The Maple Syrup Company has been a good client for the past five years. You have been requested by the managing Director of Maple Syrup company to submit an investment strategy (trading strategy to the company). Detailed below are the financial statements for the Maple Syrup Company forecasted for the next five years. Study them and respond to the analysis that you are required to complete below. \begin{tabular}{|c|c|c|c|c|c|} \hline \begin{tabular}{l} Containers \& \\ Labels \end{tabular} & 1,125 & 3,188 & 6,563 & 13,125 & 15,000 \\ \hline \begin{tabular}{l} Depreciation \\ Expense \end{tabular} & 2,360 & 3,875 & 6,985 & 10,910 & 10,910 \\ \hline Fuel & 281 & 797 & 1,641 & 3,281 & 3,750 \\ \hline Insurance & 300 & 450 & 600 & 1,000 & 1,000 \\ \hline Land Rentals & 0 & 0 & 1,000 & 6,000 & 6,000 \\ \hline \begin{tabular}{l} Membership \\ Fees \end{tabular} & 0 & 400 & 400 & 400 & 400 \\ \hline \begin{tabular}{l} Professional \\ Fees \end{tabular} & 1,000 & 500 & 500 & 500 & 500 \\ \hline \begin{tabular}{l} Property \\ Taxes \end{tabular} & 0 & 0 & 0 & 0 & 0 \\ \hline \begin{tabular}{l} Repairs \& \\ Maintenance \end{tabular} & 300 & 750 & 1,500 & 3,000 & 3,000 \\ \hline \begin{tabular}{l} Salaries, \\ Wages, \& \\ Benefits \end{tabular} & 0 & 0 & 5,000 & 10,000 & 10,000 \\ \hline \begin{tabular}{l} Small Tools \\ Expense \end{tabular} & 400 & 400 & 400 & 400 & 400 \\ \hline \end{tabular} SHERQ Version 1 Learner Portfolio of Evidence - Financial Markets Page 27 of 38 \begin{tabular}{|l|r|r|r|r|r|} \hline \begin{tabular}{l} Telephone \\ Expense \end{tabular} & 100 & 150 & 180 & 220 & 300 \\ \hline \begin{tabular}{l} Training \& \\ Trade Shows \end{tabular} & 5,000 & 500 & 500 & 500 & 27/38 \\ \hline Utilities & 100 & 250 & 500 & 1,000 & 1,000 \\ \hline \begin{tabular}{l} Interest on \\ Debt \end{tabular} & 2,482 & 3,909 & 7,842 & 11,976 & 12,160 \\ \hline \begin{tabular}{l} Overdraft \\ Interest \end{tabular} & 202 & 604 & 820 & 1,141 & \\ \hline TOTAL \\ EXPENSES \end{tabular} \begin{tabular}{|c|c|c|c|c|c|c|c|} \hline \multicolumn{8}{|c|}{\begin{tabular}{l} THE MAPLE SYRUP COMPANY \\ FORECASTED CASH FLOW STATEMENT \\ YEAR 1 (JAN. to JULY) \end{tabular}} \\ \hline & JAN & FEB. & MAR & APR & MAY & JUNE & JULY \\ \hline \begin{tabular}{l} CASH \\ INFLOWS: \end{tabular} & & & & & & & \\ \hline \begin{tabular}{l} Sales Grade \\ "A" Bulk \end{tabular} & & & & & 703 & 703 & \\ \hline \begin{tabular}{l} Sales Grade \\ "B" Bulk \end{tabular} & & & & & 527 & 527 & \\ \hline \begin{tabular}{l} Sales Grade \\ "A" Retail \end{tabular} & & & & & & & 928 \\ \hline \begin{tabular}{l} Sales Grade \\ "B" Retail \end{tabular} & & & & & & & 696 \\ \hline \begin{tabular}{l} Capital \\ Contributions \end{tabular} & 20,000 & 4,000 & & & & & \\ \hline \begin{tabular}{l} External \\ Financing \end{tabular} & & 32,000 & & & & & \\ \hline \begin{tabular}{l} TOTAL CASH \\ INFLOWS \end{tabular} & 20,000 & 36,000 & 0 & 0 & 1,230 & 1,230 & 1,624 \\ \hline \end{tabular} SHERQ Version 1 Learner Portfolio of Evidence - Financial Markets Page 22 of 38 22/38 \begin{tabular}{|c|c|c|c|c|c|c|c|} \hline \begin{tabular}{l} CASH \\ OUTFLOWS: \end{tabular} & & & & & & & \\ \hline \begin{tabular}{l} For \\ Advertising \end{tabular} & & & & & & 125 & 125 \\ \hline \begin{tabular}{l} Bank \& \\ Service \\ Charges \end{tabular} & 10 & 10 & 10 & 10 & 10 & 10 & 10 \\ \hline \begin{tabular}{l} Clean-up \& \\ Supplies \end{tabular} & & & & & 300 & & \\ \hline \begin{tabular}{l} Containers \& \\ Labels \end{tabular} & & 1,125 & & & & & \\ \hline Fuel & & & 141 & 141 & & & \\ \hline Insurance & & 300 & & & & & \\ \hline \end{tabular}
Step by Step Solution
There are 3 Steps involved in it
Step: 1

Get Instant Access to Expert-Tailored Solutions
See step-by-step solutions with expert insights and AI powered tools for academic success
Step: 2

Step: 3
Ace Your Homework with AI
Get the answers you need in no time with our AI-driven, step-by-step assistance
Get Started
Audit To Love
Authors: Jezabel Lima
1st Edition
B0C2SG8JS7, 979-8988078807