

Answered step by step
Verified Expert Solution
Question
1 Approved Answer
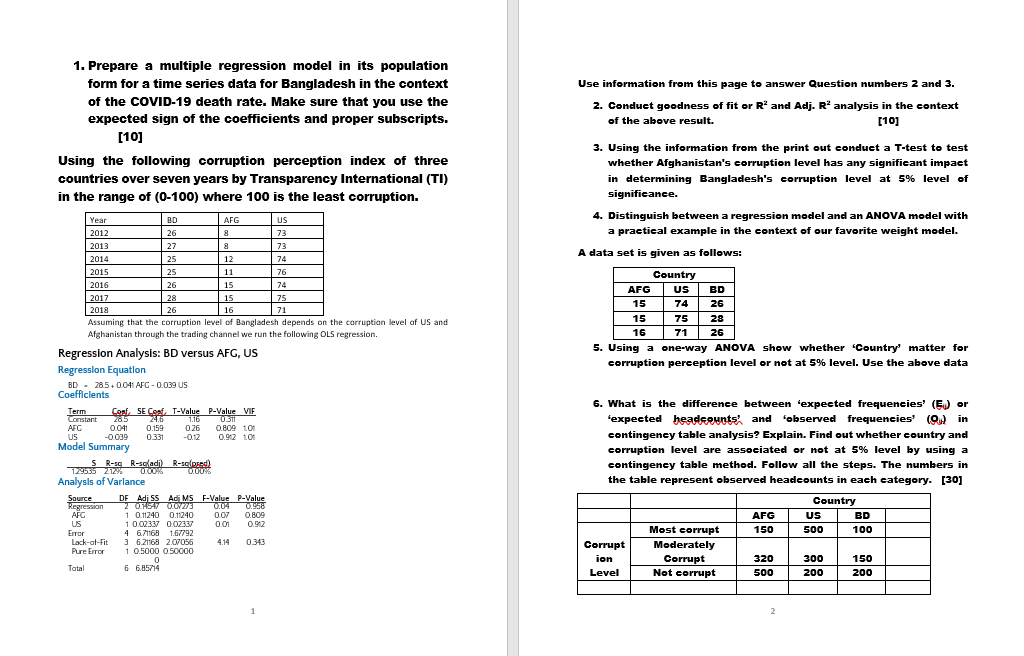
Use information from this page to answer Question numbers 2 and 3. 2. Conduct goodness of fit or R and Adj. R analysis in the
Step by Step Solution
There are 3 Steps involved in it
Step: 1

Get Instant Access to Expert-Tailored Solutions
See step-by-step solutions with expert insights and AI powered tools for academic success
Step: 2

Step: 3
Ace Your Homework with AI
Get the answers you need in no time with our AI-driven, step-by-step assistance
Get Started
Audit To Love
Authors: Jezabel Lima
1st Edition
B0C2SG8JS7, 979-8988078807