Based on the given data. Please solve question A! Thank you so much and have a great day!
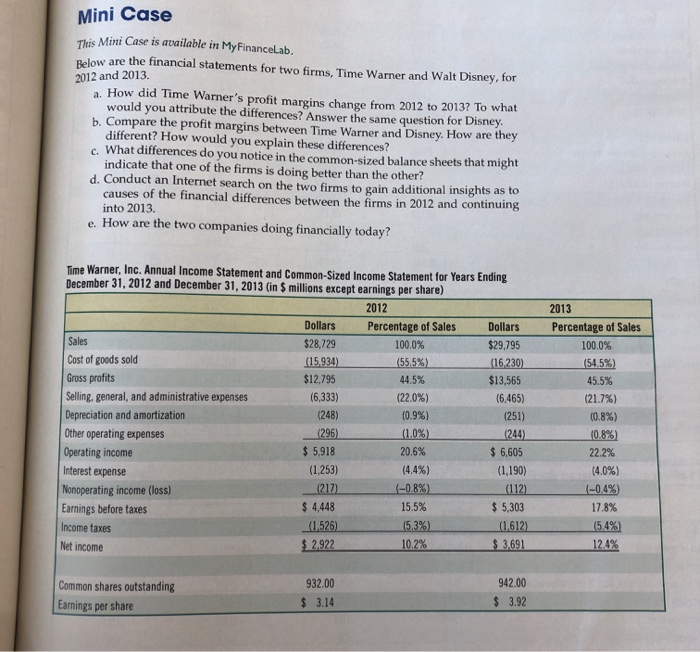
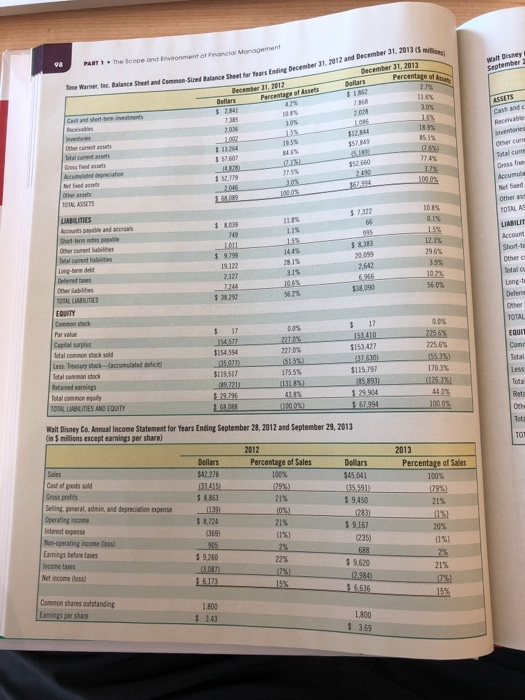
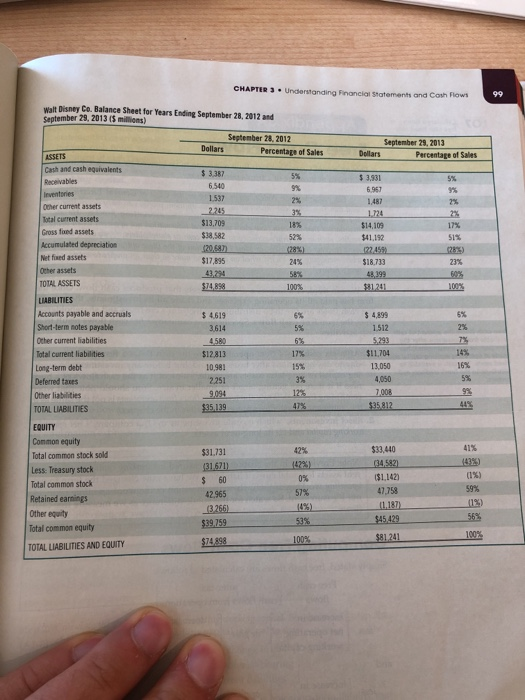
Mini Case This Mini Case is available in My FinanceLab. Below are the financial statements for two firms, Time Warner and Walt Disney, for 2012 and 2013. a. How did Time Warner's profit margins change from 2012 to 2013? To what would you attribute the differences? Answer the same question for Disney b. Compare the profit margins between Time Warner and Disney. How are they different? How would you explain these differences? c. What differences do you notice in the common-sized balance sheets that might indicate that one of the firms is doing better than the other? d. Conduct an Internet search on the two firms to gain additional insights as to causes of the financial differences between the firms in 2012 and continuing into 2013. e. How are the two companies doing financially today? Time Warner, Inc. Annual Income Statement and Common-Sized Income Statement for Years Ending December 31, 2012 and December 31, 2013 in 5 millions except earnings per share) 2012 2012 Percentage of Sales Sales Cost of goods sold Gross profits Selling, general, and administrative expenses Depreciation and amortization Other operating expenses Operating income Interest expense Nonoperating income (loss) Earnings before taxes Income taxes Net income Dollars $28,729 (15.934) $12.795 (6,333) (248) (296) $ 5,918 (1,253) (217) $ 4,448 Percentage of Sales 100.0% (55.5%) 44.5% (22.0%) (0.9%) (1.0%) 20.6% (4.4%) (-0.8%) 15.5% (5.3%) 10.2% Dollars $29,795 (16.230) $13,565 (6,465) (251) (244) $ 6,605 (1,190) (112) $ 5,303 (1612) (54.5%) 45.5% (21.7%) (0.8%) 10.8% 22.2% (4.0%) (-0.4% 17.8% (5.4%) 12.4% (1.526) $ 2922 $ 3.691 Common shares outstanding Earnings per share 932.00 $ 3.14 942.00 $ 3.92 PART The Scope and Environment of Financial Manager September December 31, 2012 and December 31, 2013 December 31, 2013 Percentage of Time Warner in Balance Sheet and Commen Sih Dollars Balance Sheet and Commen Sired Balance Sheet for December 31, 2017 Dollars ESSETS Cash and Recevable 30% $57869 19 $3650 85.1 02 77.4% Other CUTE Total cute $ 57,607 35 7755 10005 0.1% $ 7332 LABILITIES $8009 1011 $9.99 Accumul et und Other : TOTALAS LIABILIT Account Short-te Other Total Long- Defense Other TOTAL 2.127 315 2965 3.9% 1022 560" 20.099 2.642 5.956 $38.090 Shorts Other current lubilities Totalc i tes Long-term debet Deferred to Other abilities TSAL LIABILITIES FOUNTY Costock Par value Cap surplus Totalcommon stock sold Lessa ry stock(cumulated delicit) 38 0.0% 14577 $154,554 05.077) $119.517 189.721) 29.795 227 (5155 17555 (131.85 838% (105) $ 17 151410 $153427 37.630) $115797 35893) $ 29,904 $67.994 0.0% 2255 2256% 1553%) 170.3% (125.3%) Redmi Totalcommon equity TOTAL LIABLITIES AND EQUITY Walt Disney Co. Annual Income Statement for Years Ending September 28, 2012 and September 29, 2013 in 5 milions encept earnings per share) Percentage of Sales 100% (79%) Dollars $45,041 2013 Percentage of Sales 100% 79%) Sales Cast of goods sold Gross profits Selling general, admin, and depreciation Expense Dollars $42.278 21415 $ 8.853 (139) $ 8.124 21% $ 9.450 21% 10%) 21% (133 (199 205 69 $ 9.167 (235) No-operating Income Oss Earnings before the 95 21% $ 9250 30 $6.173 Net Income dess $ 9,620 12.584) $ 5.636 15% Common shares outstanding Eames per share $ 3.43 1800 3.59 $ CHAPTER 3. Understanding Financial Statements and Cash Flow 99 September 29, 2013 Dollars Percentage of Sales $ 3.931 Receivables 6.967 1187 1724 Walt Disney Co. Balance Sheet for Years Ending September 28, 2012 and September 29, 2013 $ millions) September 28, 2012 Dollars Percentage of Sales ASSETS Cash and cash equivalents $ 3.387 6.540 1.537 Other current assets Total current assets $13.709 Gross and assets $38.582 52% Accumulated depreciation 20,583 08%) Net fixed assets $17,895 24% Other assets 43.294 TOTAL ASSETS $74.898 LIABILITIES Accounts payable and accruals $ 4619 Short-term notes payable 3.614 Other current liabilities Total current liabilities $12813 Long-term debt 10.981 Deferred taxes 2251 Other liabilities TOTAL LIABILITIES $14,109 $41,192 1224591 $18.733 51% 2825 23% 60% 31201 $ 4.899 1.512 4580 16% $11,704 13,050 4,050 7.008 $35 812 $35.139 475 41% 0%) EQUITY Common equity Total common stock sold Less: Treasury stock Total common stock Retained earnings Other equity Total common equity TOTAL LIABILITIES AND EQUITY $31.731 (31671 $ 60 42.965 (3266) $39759 0% 57% $33,440 (34,582) $1,142 47,758 11.187) $45429 59% 53% 56% 100% $74898 100% $81.241