

Answered step by step
Verified Expert Solution
Question
1 Approved Answer
Based on the given data. Please solve question E. Thank you so much and have a great day! Mini Case This Mini Case is available
Based on the given data. Please solve question E. Thank you so much and have a great day! 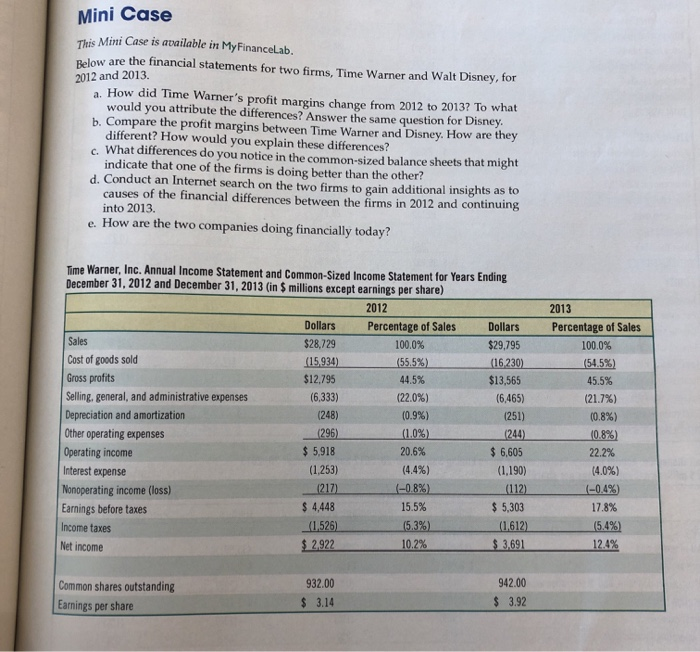
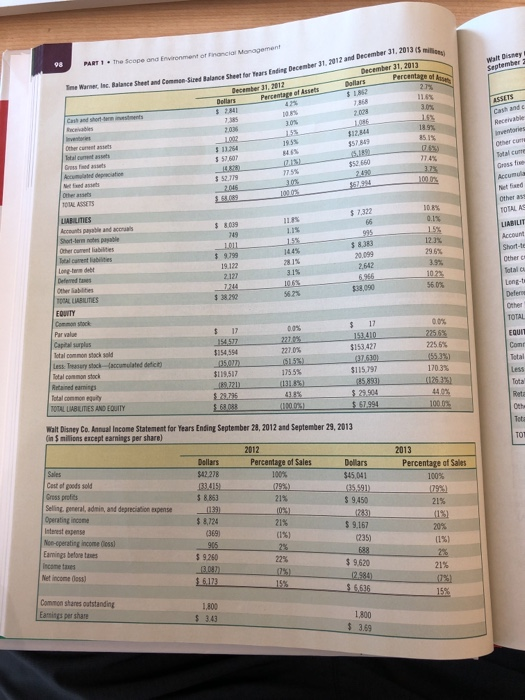
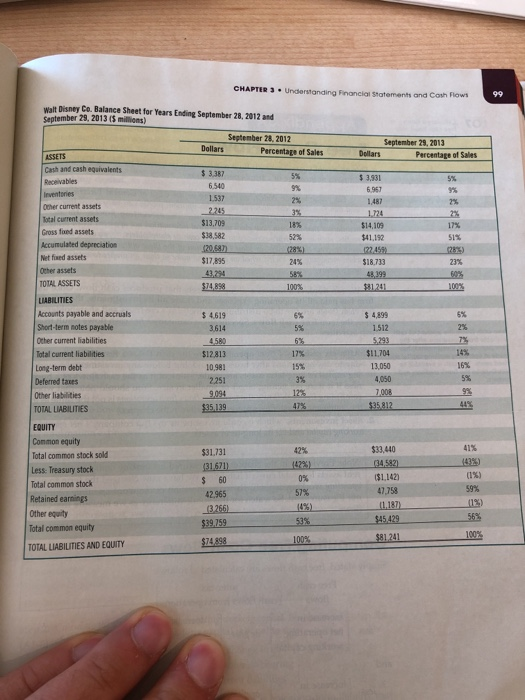
Mini Case This Mini Case is available in My FinanceLab. Below are the financial statements for two firms, Time Warner and Walt Disney, for 2012 and 2013. a. How did Time Warner's profit margins change from 2012 to 2013? To what would you attribute the differences? Answer the same question for Disney. b. Compare the profit margins between Time Warner and Disney. How are they different? How would you explain these differences? c. What differences do you notice in the common-sized balance sheets that might indicate that one of the firms is doing better than the other? d. Conduct an Internet search on the two firms to gain additional insights as to causes of the financial differences between the firms in 2012 and continuing into 2013. e. How are the two companies doing financially today? Time Warner, Inc. Annual Income Statement and Common-Sized Income Statement for Years Ending December 31, 2012 and December 31, 2013 in 5 millions except earnings per share) 2012 2013 Percentage of Sales Sales Cost of goods sold Gross profits Selling, general, and administrative expenses Depreciation and amortization Other operating expenses Operating income Interest expense Nonoperating income (loss) Earnings before taxes Income taxes Net income Dollars $28,729 (15.934) $12.795 (6,333) (248) (296) $ 5,918 (1,253) (217) $ 4,448 Percentage of Sales 100.0% (55.5%) 44.5% (22.0%) (0.9%) (1.0%) 20.6% (4.4%) (-0.8%) 15.5% (5.3%) 10.2% Dollars $29,795 (16230) $13,565 (6,465) (251) (244) $ 6,605 (1,190) (112) $ 5,303 (1612) $ 3.691 (54.5%) 45.5% (21.7%) (0.8%) 10.8%) 22.2% (4.0%) (1.526) $ 2.922 17.8% (5.4%) 12.4% Common shares outstanding Earnings per share 932.00 $ 3.14 942.00 $ 3.92 PART The Scope and Environment of Financial Manager September December 31, 2012 and December 31, 2013 December 31, 2013 Percentage of Time Warner in Balance Sheet and Commen Sie Dollars Balance Sheet and Commen Sired Balance Sheet for SUM Dollars ESSETS 2.008 Cash and Rectable 30% $57 819 Other cute Sotalt $ 57,607 77.4% 7755 1249 102.03 0.1% $8009 2.55 1011 $9.99 995 S833 20.099 2.642 5.956 $38,090 Acum et und Other : TOTALAS LIABILIT Account Short-te Other Total Long-t Defense Other TOTAL 2965 3.9% 1022 2 127 7244 $38 LABILITIES Acope and Short-term Other current lubilities Totalci tes Long-term debet Deferred to Other Babies TSAL LIABILITIES FOUNTY Dostock Par value Capital surplus Totalcommon stock sold Less Teaserstock(cumulated delicit) Totalcommon stock Retained earnings Totalcommon equity TOTAL BLITIES AND EQUITY 562% 0.0% 0.0% 14577 $154,554 05.07) $119.517 89.721) 29.795 SA 2256% 53%) 170.3% $ 17 151410 $153427 37.630) $115797 85893) $ 23,904 $167.994 227% (5155 175.5% (131.85 838% 1000 Walt Disney Co. Annual Income Statement for Years Ending September 28, 2012 and September 29, 2013 in 5 milions except earnings per share) Dollars Percentage of Sales 100% (79%) Dollars $45,041 Sales Cast of goods sold Gross profits Selling general, admin, and depreciation expense 2013 Percentage of Sales 100% 129) 21% 2015 $ 8.853 1291 21% $ 9.450 $ 8.124 69 10%) 21% (199 205 $ 9.167 (235) No-operating Income Oss Earnings before 28 21% $ 9250 RO $ 6172 Net Income dess] $ 9.620 12.984) $ 5,616 15 Common shares outstanding Eames per share 1,800 3.43 $ 1.800 3.69 $ CHAPTER 3. Understanding Financial Statements and Cash Flows 90 September 29, 2013 Dollars Percentage of Sales $ 3.931 Receivables 1.487 1724 18 Walt Disney Co. Balance Sheet for Years Ending September 28, 2017 and September 29, 2013 $ millions) September 28, 2012 Dollars Percentage of Sales ASSETS Cash and cash equivalents $ 3.387 6540 1537 Other current assets Total current assets $13.709 Cross and assets $38,582 Accumulated depreciation 120,583 (28%) Net fixed assets $17,895 24% Other assets 43294 TOTAL ASSETS $74.898 LIABILITIES Accounts payable and accruals $ 4619 Short-term notes payable 3.614 Other current liabilities Total current liabilities $12.813 17% Long-term debt 10.981 Deferred taus 2251 Other liabilities TOTAL LIABILITIES $14,109 $41,192 122 4591 $18.733 51% 2825) 23% 60% 100% 4580 $ 4,899 1.512 5.293 $11704 13,050 4,050 7.008 $35 812 16% $35.139 475 EQUITY 41% Common equity Total common stock sold Less: Treasury stock Total common stock Retained earnings Other equity Total common equity TOTAL LIABILITIES AND EQUITY $31.731 (31621) $ 60 42.965 13266) $39759 59% $33,440 34,582) $1142) 47,758 11.1871 $45.429 0% 57% (4%) 53% 56% $81.241 100% $74898 100% Step by Step Solution
There are 3 Steps involved in it
Step: 1

Get Instant Access to Expert-Tailored Solutions
See step-by-step solutions with expert insights and AI powered tools for academic success
Step: 2

Step: 3
Ace Your Homework with AI
Get the answers you need in no time with our AI-driven, step-by-step assistance
Get Started
Forex Trading Currency Trading Made Simple The Ultimate Forex Guide For Beginners Secret Strategies Tips And Tricks
Authors: Mark Stock
1st Edition
1081958723, 978-1081958725