Based on the given information, analyse company's financial health and provide future projections. Unit FY16 FY17 FY18 FY19 Sales Rs. Cr 134 245 371 1,159
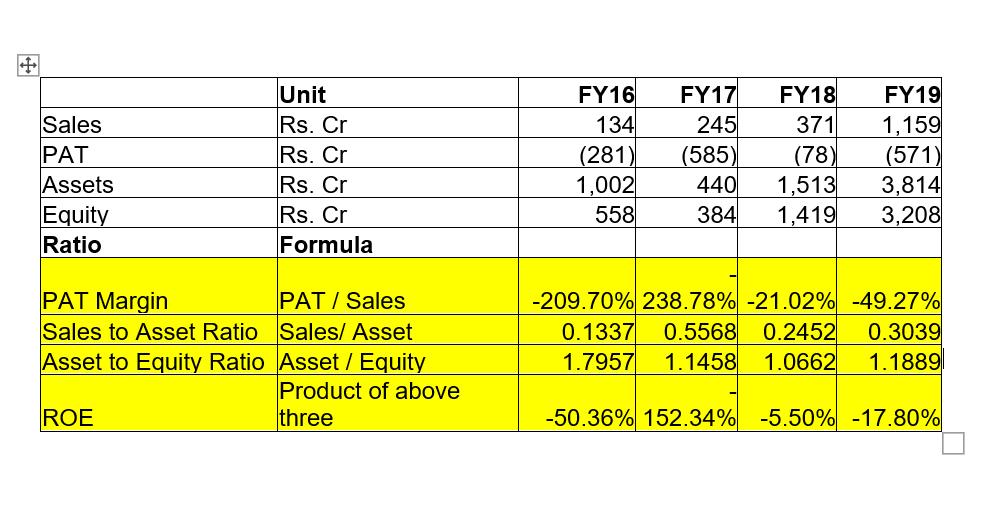
Based on the given information, analyse company's financial health and provide future projections.

Unit FY16 FY17 FY18 FY19 Sales Rs. Cr 134 245 371 1,159 PAT Rs. Cr (281) (585) (78) (571) Assets Rs. Cr 1,002 Equity Rs. Cr 558 440 1,513 3,814 384 1,419 3,208 Ratio PAT Margin Sales to Asset Ratio Asset to Equity Ratio ROE Formula PAT / Sales Sales/ Asset Asset / Equity Product of above three -209.70% 238.78% -21.02% -49.27% 0.1337 0.5568 0.2452 0.3039 1.7957 1.1458 1.0662 1.1889 -50.36% 152.34% -5.50% -17.80%
Step by Step Solution
There are 3 Steps involved in it
Step: 1
Based on the table the companys financial health has fluctuated significantly over the past 4 years FY16FY19 Here are some specific observations Sales There has been significant growth in sales from R...
See step-by-step solutions with expert insights and AI powered tools for academic success
Step: 2

Step: 3

Ace Your Homework with AI
Get the answers you need in no time with our AI-driven, step-by-step assistance
Get Started


