

Answered step by step
Verified Expert Solution
Question
1 Approved Answer
Based on the given information and excel sheet, should Allbob sell to Catbob at that $60000 price? If not, what is the optimal price? Case
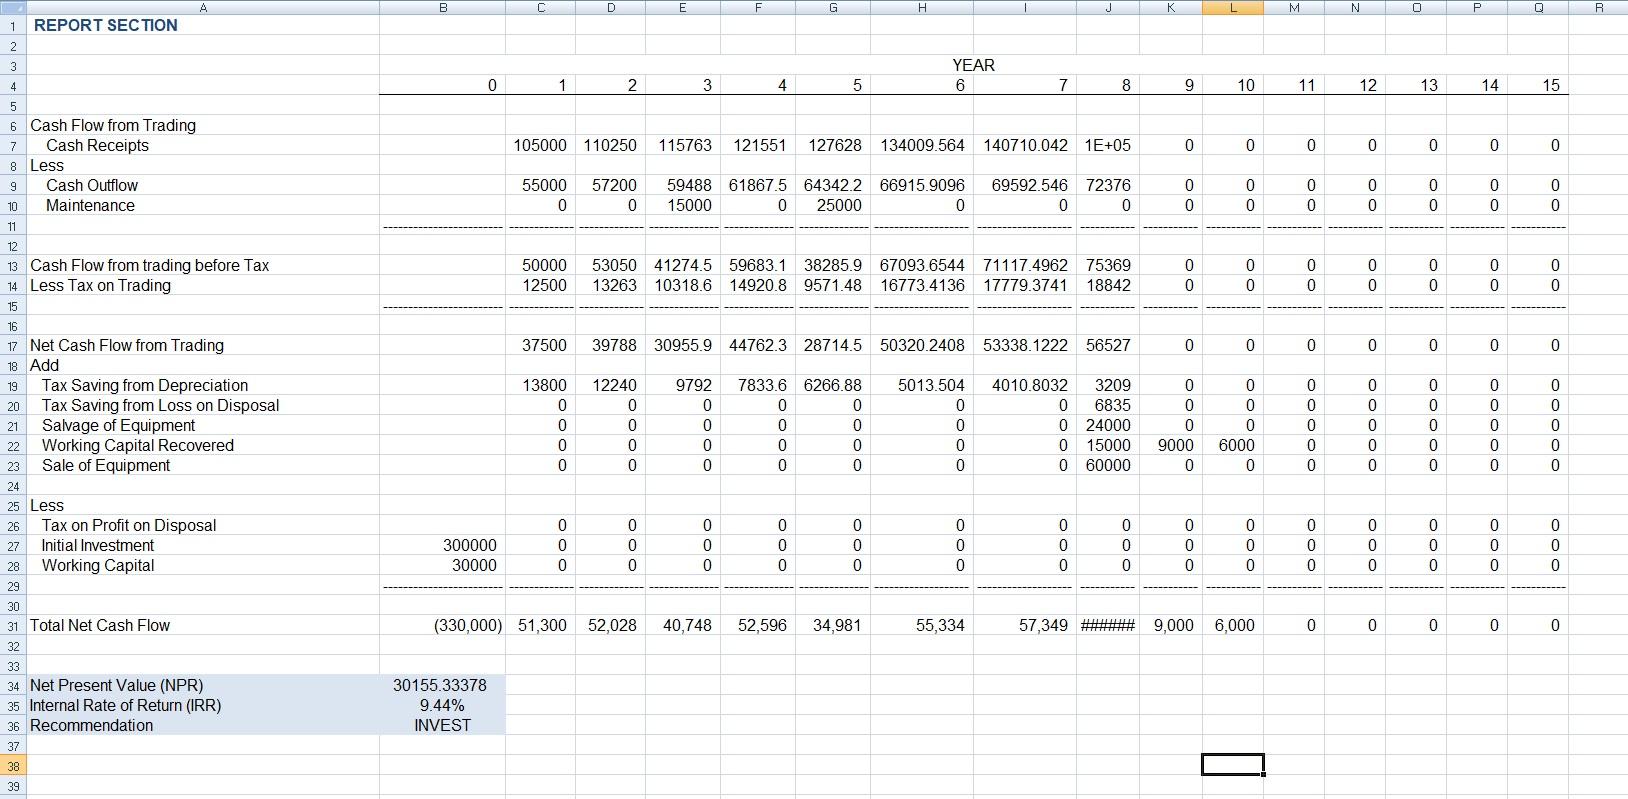
Based on the given information and excel sheet, should Allbob sell to Catbob at that $60000 price? If not, what is the optimal price?
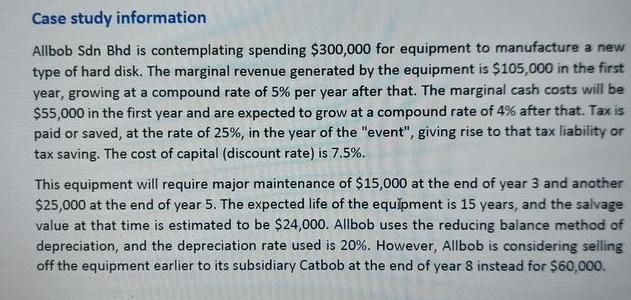
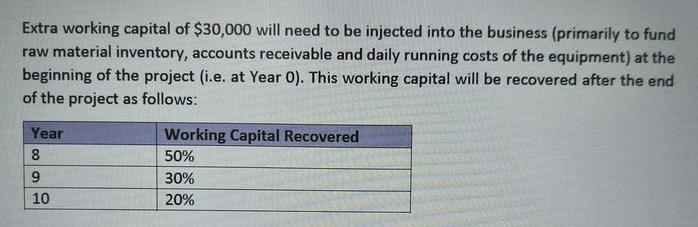
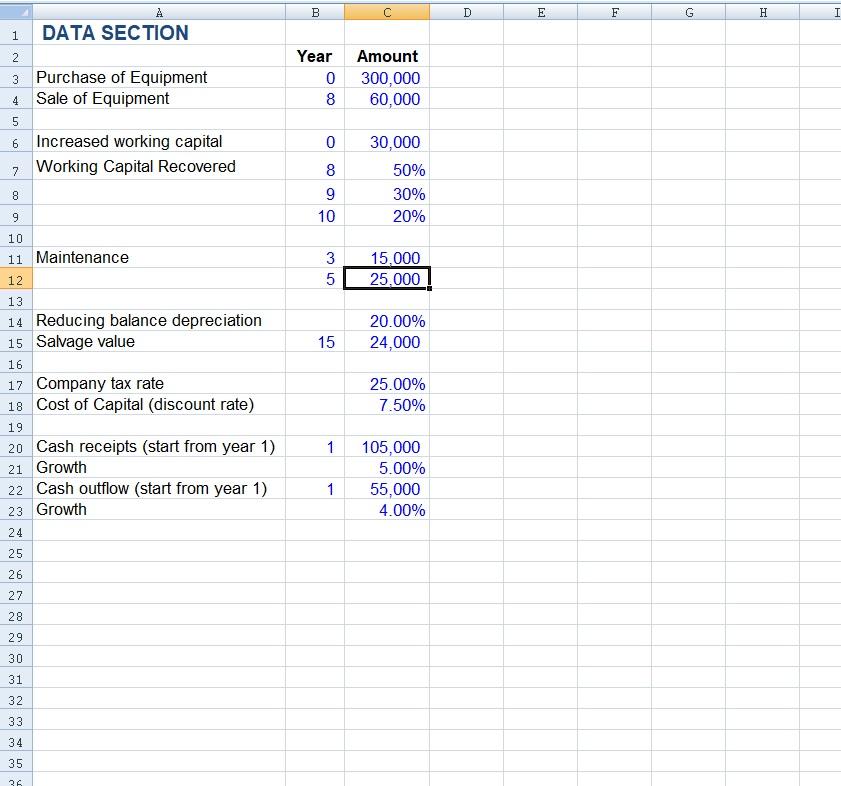
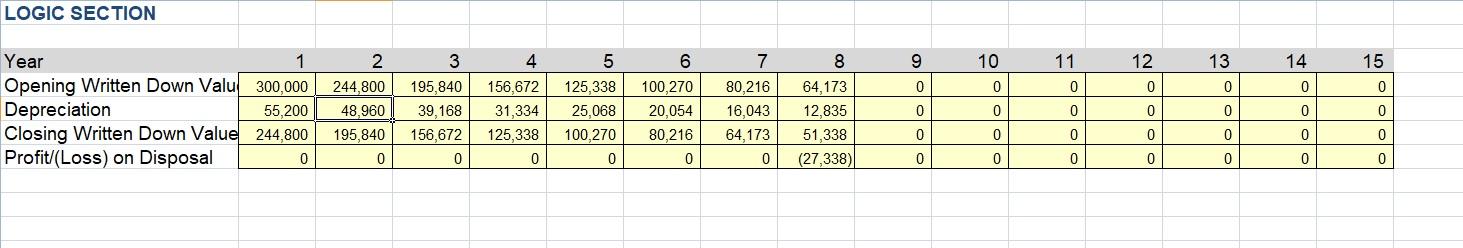
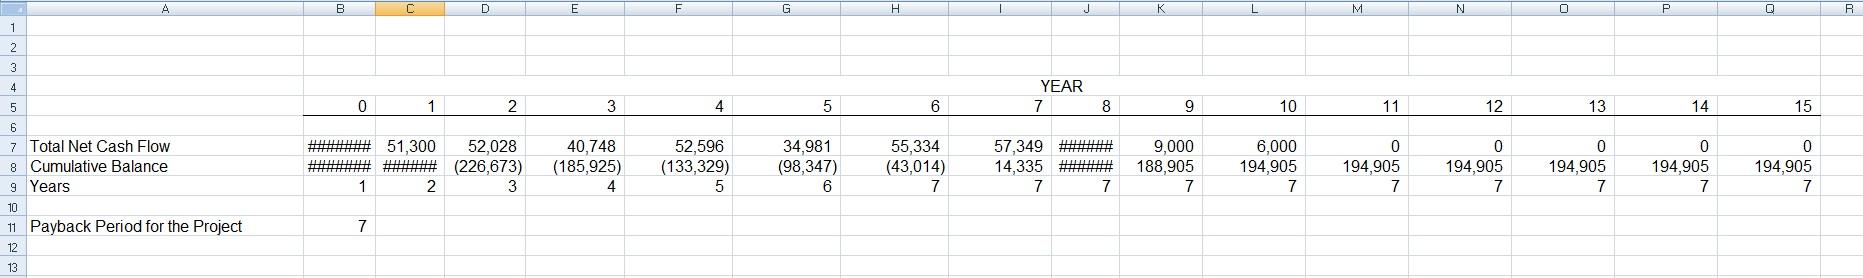
Case study information Allbob Sdn Bhd is contemplating spending $300,000 for equipment to manufacture a new type of hard disk. The marginal revenue generated by the equipment is $105,000 in the first year, growing at a compound rate of 5% per year after that. The marginal cash costs will be $55,000 in the first year and are expected to grow at a compound rate of 4% after that. Tax is paid or saved, at the rate of 25%, in the year of the "event", giving rise to that tax liability or tax saving. The cost of capital (discount rate) is 7.5%. This equipment will require major maintenance of $15,000 at the end of year 3 and another $25,000 at the end of year 5. The expected life of the equipment is 15 years, and the salvage value at that time is estimated to be $24,000. Allbob uses the reducing balance method of depreciation, and the depreciation rate used is 20%. However, Allbob is considering selling off the equipment earlier to its subsidiary Catbob at the end of year 8 instead for $60,000. Extra working capital of $30,000 will need to be injected into the business (primarily to fund raw material inventory, accounts receivable and daily running costs of the equipment) at the beginning of the project (i.e. at Year O). This working capital will be recovered after the end of the project as follows: Year 8 9 10 Working Capital Recovered 50% 30% 20% B D E F L. G H 1 DATA SECTION 2 3 Purchase of Equipment 4 Sale of Equipment Year 0 8 Amount 300,000 60,000 5 0 6 Increased working capital 7. Working Capital Recovered 30,000 50% 30% 20% 8 9 10 00 9 10 11 Maintenance 12 _ 3 5 15.000 25.000 13 14 Reducing balance depreciation 15 Salvage value 20.00% 24,000 15 16 17 Company tax rate 18 Cost of Capital (discount rate) 25.00% 7.50% 19 1 20 Cash receipts (start from year 1) 21 Growth 22 Cash outflow (start from year 1) 23 Growth 105,000 5.00% 55,000 4.00% 1 24 25 26 27 28 29 30 31 32 33 34 35 26 LOGIC SECTION Year 3 4 5 6 8 9 10 11 12 13 14 15 0 0 0 0 0 0 0 1 Opening Written Down Valu 300,000 Depreciation 55,200 Closing Written Down Value 244,800 Profit/(Loss) on Disposal 0 2 244,800 48.960 195,840 195,840 39,168 156,672 156,672 31,334 125,338 125,338 25,068 100,270 100,270 20,054 80,216 7 80.216 16,043 64.173 0 0 0 0 0 0 0 64,173 12,835 51,338 (27,338) 0 0 0 0 0 0 0 0 0 0 0 0 0 0 0 0 0 0 0 0 A B B C D E F G H K L. M N O P R 1 REPORT SECTION 2 3 YEAR 6 4 0 1 2 3 4 5 7 8 9 10 11 12 13 14 15 5 105000 110250 115763 121551 127628 134009.564 140710.042 1E+05 0 0 0 0 0 0 0 6 Cash Flow from Trading 7 Cash Receipts 8 Less 9 Cash Outflow Maintenance 55000 0 57200 0 59488 61867.5 64342.2 66915.9096 15000 0 25000 0 69592.546 72376 0 0 0 0 0 0 0 0 0 0 0 0 0 0 0 0 0 10 11 12 0 13 Cash Flow from trading before Tax 14 Less Tax on Trading 50000 12500 53050 41274.5 59683.1 38285.9 67093.6544 71117.4962 75369 13263 10318.6 14920.8 9571.48 16773.4136 17779.3741 18842 0 0 0 0 Oo 0 0 0 0 0 0 0 0 15 37500 39788 30955.9 447623 28714.5 50320.2408 53338.1222 56527 0 0 0 0 0 0 0 19 12240 0 Oo 13800 0 0 0 0 OOoC 9792 0 0 0 7833.6 6266.88 0 0 0 0 5013.504 0 0 0 0 0 OOOC 4010.8032 3209 0 6835 0 24000 0 15000 0 60000 0 0 0 9000 0 OOOOO 0 6000 0 OOOOO OOOOO 22 0 OO OO 16 17 Net Cash Flow from Trading 18 Add Tax Saving from Depreciation 20 Tax Saving from Loss on Disposal 21 Salvage of Equipment Working Capital Recovered 23 Sale of Equipment 24 25 Less 26 Tax on Profit on Disposal 27 Initial Investment 28 Working Capital 29 30 31 Total Net Cash Flow 32 0 300000 30000 OOO OOO 0 0 0 0 OOO OOO OOO 0 0 0 OOO OOO OOO OOO OOO 0 0 0 0 0 0 0 0 0 0 0 OOO 0 0 0 (330,000) 51,300 52,028 40,748 52,596 34,981 55,334 57,349 #******** 9,000 6,000 0 0 0 0 0 0 33 34 Net Present Value (NPR) 35 Internal Rate of Return (IRR) 36 Recommendation 30155.33378 9.44% INVEST 37 38 39 A B C D E F G G H M N O P Q R 1 2 3 4 YEAR 7 5 0 0 1 1 2 3 4 5 6 8 8 9 10 11 12 13 14 15 51,300 6 7 Total Net Cash Flow 8 Cumulative Balance 9 Years 52,028 (226,673) 3 40,748 (185,925) 4 52,596 (133,329) 5 34,981 (98,347) 6 55,334 (43,014) 7 57,349 14,335 7 9,000 188,905 7 6,000 194,905 7 0 194,905 7 0 194,905 7 0 194,905 7 0 194,905 7 0 194,905 7 1 2 7 10 11 Payback Period for the Project 7 12 13Step by Step Solution
There are 3 Steps involved in it
Step: 1

Get Instant Access to Expert-Tailored Solutions
See step-by-step solutions with expert insights and AI powered tools for academic success
Step: 2

Step: 3
Ace Your Homework with AI
Get the answers you need in no time with our AI-driven, step-by-step assistance
Get Started
The Laymans Guide To Managing Your Investments
Authors: Thomas Dunleavy
1st Edition
979-8763592214