 Based on the given information of #6 and #7, answer question #8. The mean values for constructing the bar graph are in question #7.
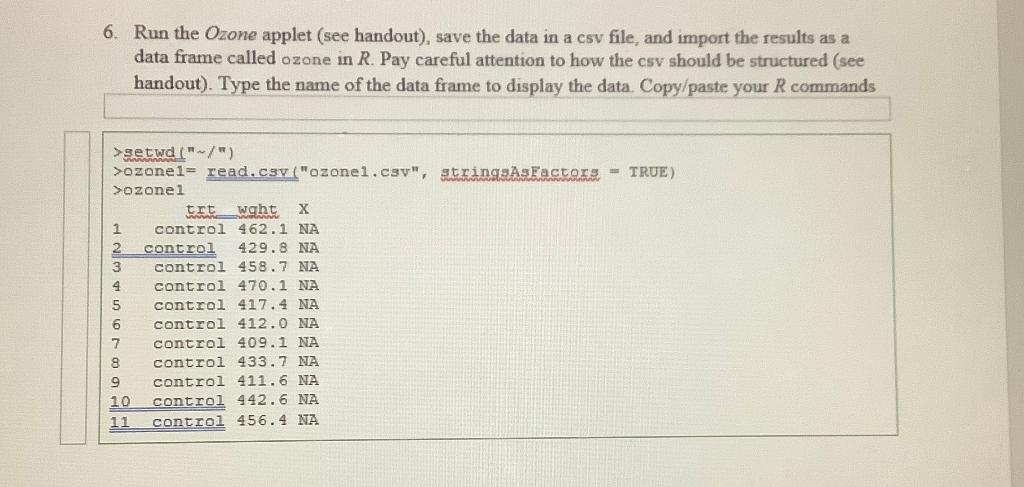
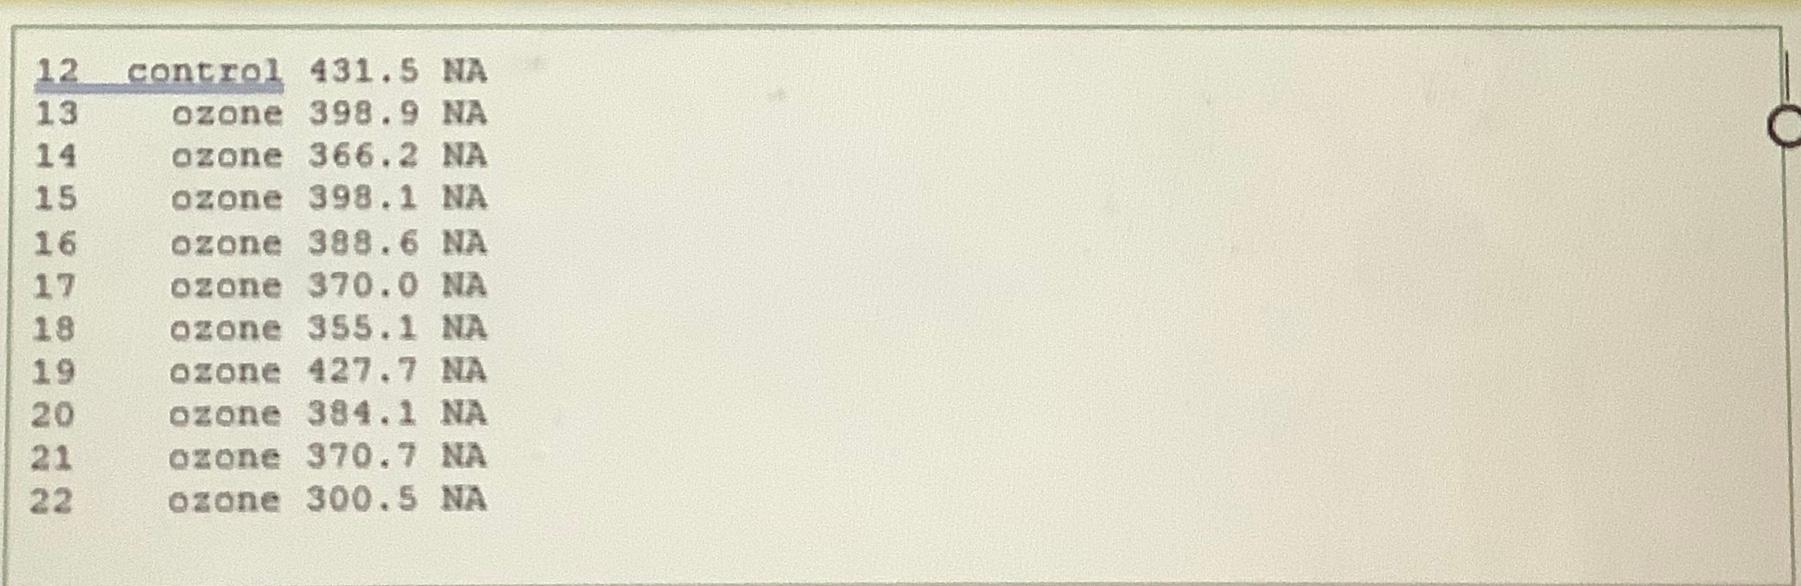
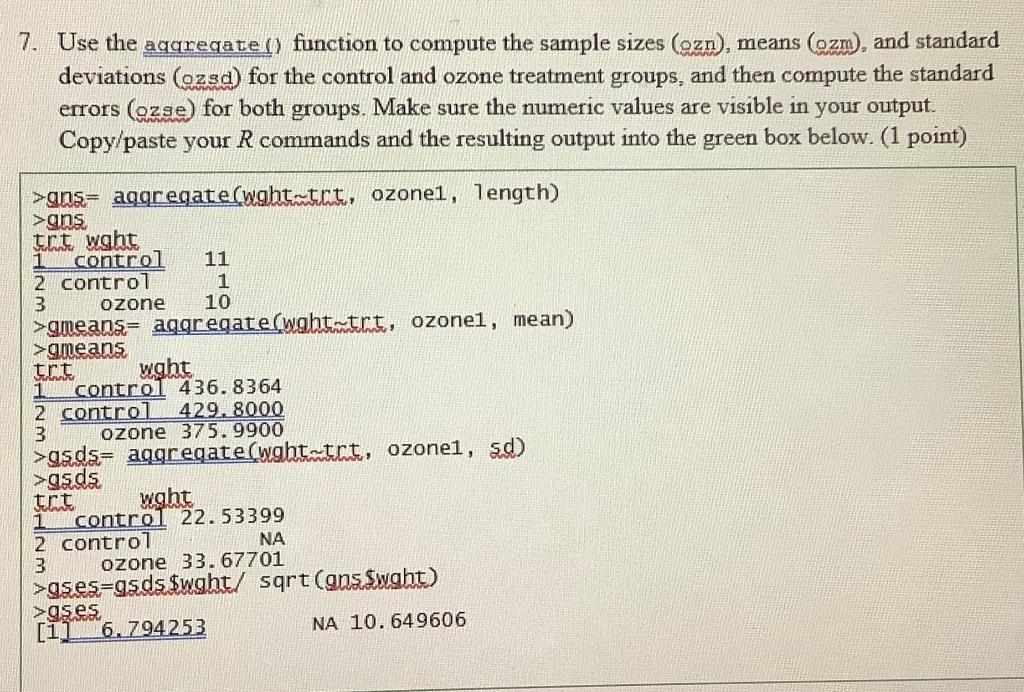
6. Run the Ozone applet (see handout), save the data in a csv file, and import the results as a data frame called ozone in R. Pay careful attention to how the csv should be structured (see handout). Type the name of the data frame to display the data. Copy/paste your R commands >getwd("/") >ozonel= read.csv ("ozonel.csv", stringsAsFactors - TRUE) >ozonel trt wght 1 control 462.1 NA 2 control 429.8 NA 3 control 458.7 NA 4 control 470.1 NA 5 control 417.4 NA 6 control 412.0 NA 7 control 409.1 NA 8 control 433.7 NA 9 control 411.6 NA 10 control 442.6 NA 11 control 456.4 NA 12 13 14 15 16 17 19 19 20 21 22 control 431.5 NA ozone 398.9 NA ozone 366.2 NA ozone 398.1 NA ozone 388.6 NA ozone 370.0 NA ozone 355.1 NA ozone 427.7 NA ozone 384.1 NA azone 370.7 NA ozone 300.5 NA 7. Use the aggregates) function to compute the sample sizes (ezn), means (ozm), and standard deviations (ozsd) for the control and ozone treatment groups, and then compute the standard errors (ozse) for both groups. Make sure the numeric values are visible in your output. Copy/paste your R commands and the resulting output into the green box below. (1 point) >gns= aggregaterwght-tct, ozonei, length) >gns trt wght 1 control 11 2 control 1 3 ozone 10 >gmeans= aggregate (wght-trt, ozone1, mean) >gmeans trit wght control 436.8364 2 control 429. 8000 3 ozone 375.9900 >gsds= aggregate(wghtort, ozone1, sd) >gsds. trit wght control 22.53399 2 control NA 3 ozone 33. 67701 >gses-gads$wght/ sqrt (gns.Swght) >gses, [1] 6.794253 NA 10.649606 8. Create a bar plot of the means for the control and ozone treatment groups. Add standard error bars to the plot. Copy/paste your R commands and the resulting figure into the green box below. (1 point) 6. Run the Ozone applet (see handout), save the data in a csv file, and import the results as a data frame called ozone in R. Pay careful attention to how the csv should be structured (see handout). Type the name of the data frame to display the data. Copy/paste your R commands >getwd("/") >ozonel= read.csv ("ozonel.csv", stringsAsFactors - TRUE) >ozonel trt wght 1 control 462.1 NA 2 control 429.8 NA 3 control 458.7 NA 4 control 470.1 NA 5 control 417.4 NA 6 control 412.0 NA 7 control 409.1 NA 8 control 433.7 NA 9 control 411.6 NA 10 control 442.6 NA 11 control 456.4 NA 12 13 14 15 16 17 19 19 20 21 22 control 431.5 NA ozone 398.9 NA ozone 366.2 NA ozone 398.1 NA ozone 388.6 NA ozone 370.0 NA ozone 355.1 NA ozone 427.7 NA ozone 384.1 NA azone 370.7 NA ozone 300.5 NA 7. Use the aggregates) function to compute the sample sizes (ezn), means (ozm), and standard deviations (ozsd) for the control and ozone treatment groups, and then compute the standard errors (ozse) for both groups. Make sure the numeric values are visible in your output. Copy/paste your R commands and the resulting output into the green box below. (1 point) >gns= aggregaterwght-tct, ozonei, length) >gns trt wght 1 control 11 2 control 1 3 ozone 10 >gmeans= aggregate (wght-trt, ozone1, mean) >gmeans trit wght control 436.8364 2 control 429. 8000 3 ozone 375.9900 >gsds= aggregate(wghtort, ozone1, sd) >gsds. trit wght control 22.53399 2 control NA 3 ozone 33. 67701 >gses-gads$wght/ sqrt (gns.Swght) >gses, [1] 6.794253 NA 10.649606 8. Create a bar plot of the means for the control and ozone treatment groups. Add standard error bars to the plot. Copy/paste your R commands and the resulting figure into the green box below. (1 point)