

Answered step by step
Verified Expert Solution
Question
1 Approved Answer
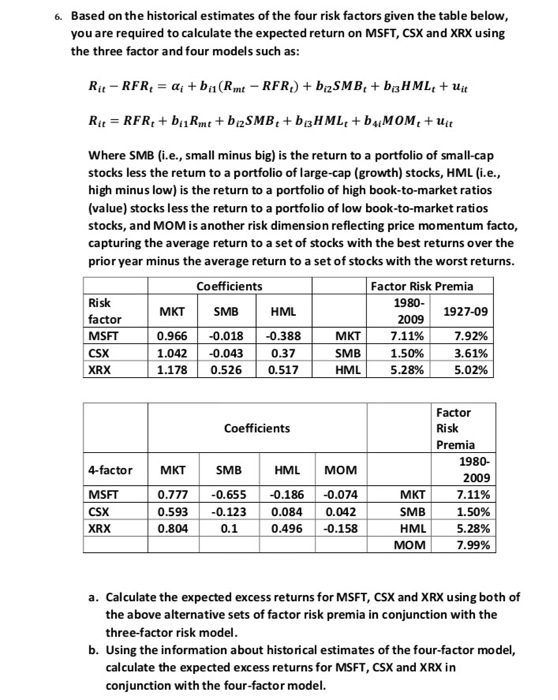
Based on the historical estimates of the four risk factors given the table below you are required to calculate the expected return on MSFT, CSX
Step by Step Solution
There are 3 Steps involved in it
Step: 1

Get Instant Access to Expert-Tailored Solutions
See step-by-step solutions with expert insights and AI powered tools for academic success
Step: 2

Step: 3
Ace Your Homework with AI
Get the answers you need in no time with our AI-driven, step-by-step assistance
Get Started
Passive Income Stacking Handbook How To Reach Financial Freedom Faster Regardless Of Your Age Or Situation
Authors: Mark Walters
1st Edition
0578530171, 978-0578530178