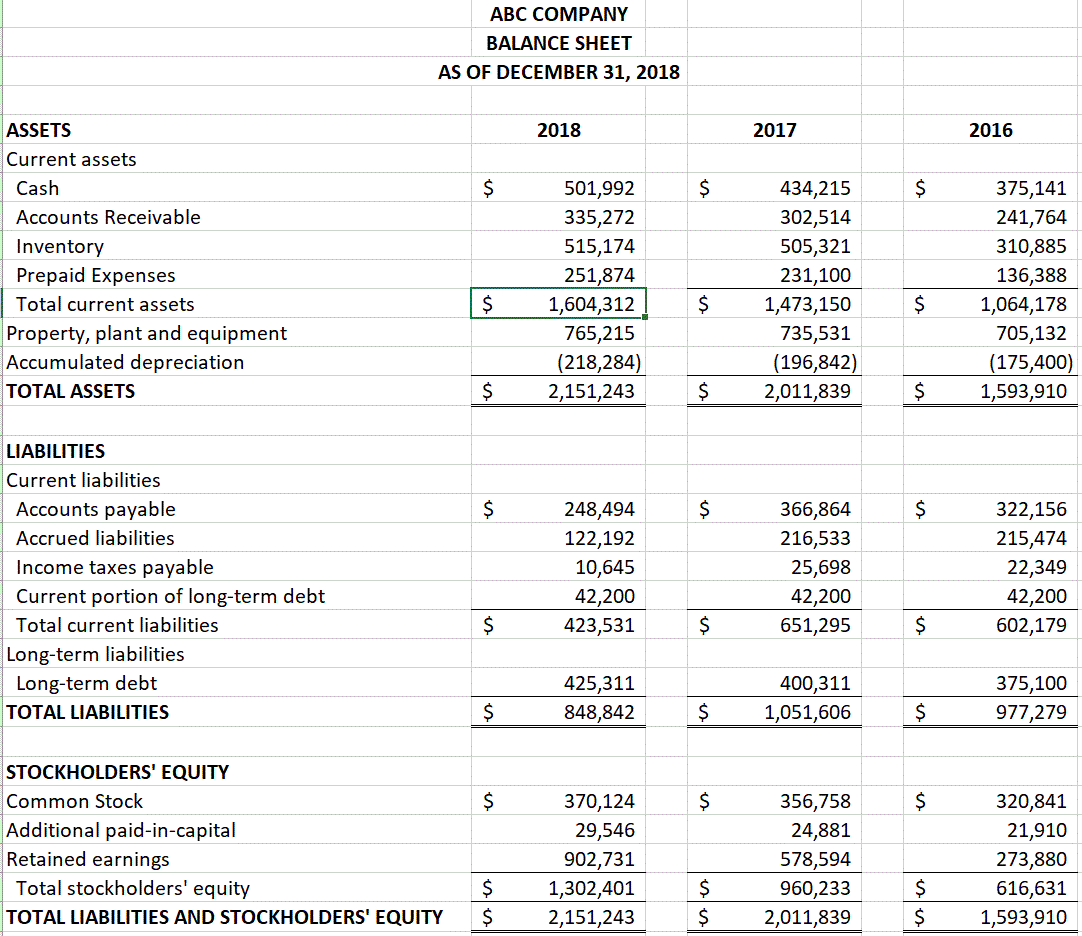
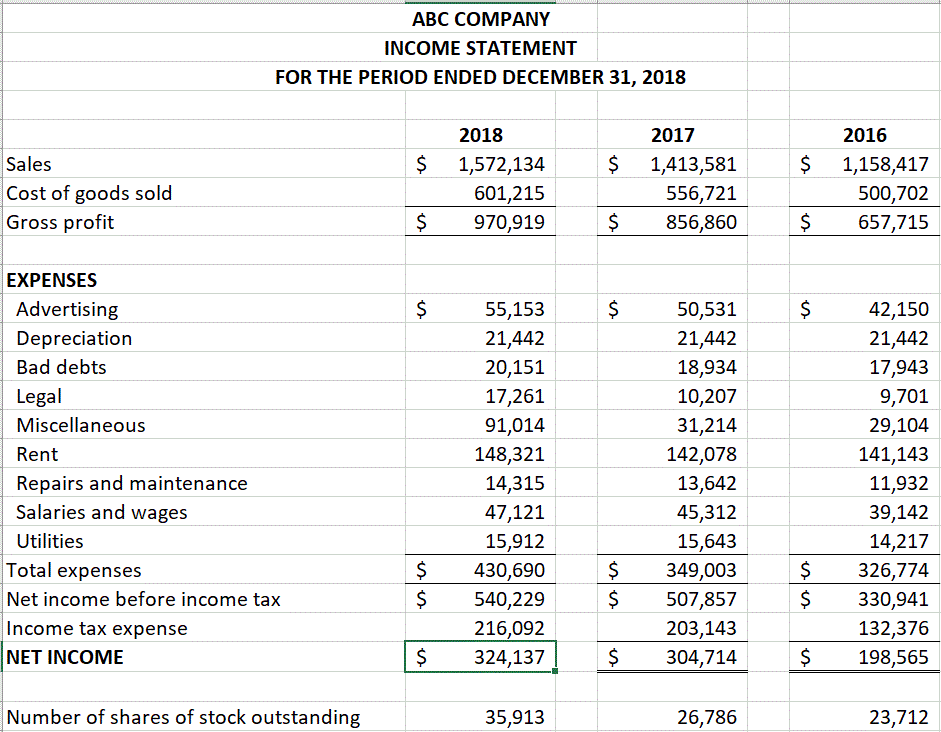
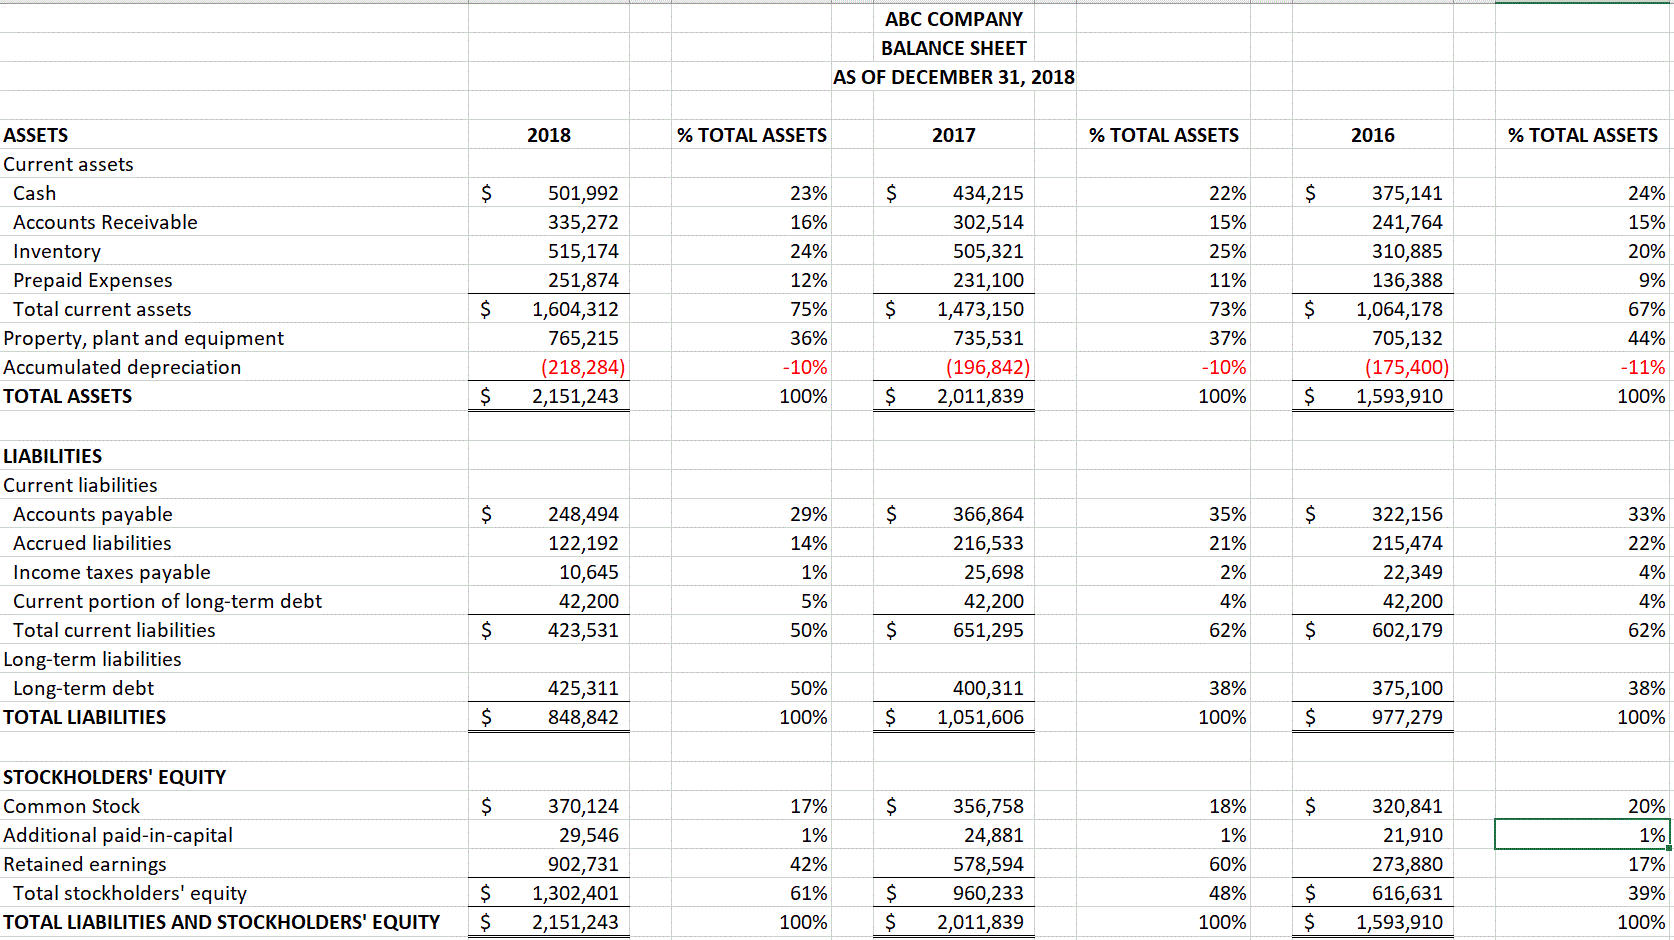
- Based on the horizontal and vertical analysis, identify at least three possible red flags and indicate if a reasonable explanation exists in 12 sentences for each of the areas of concern you choose.
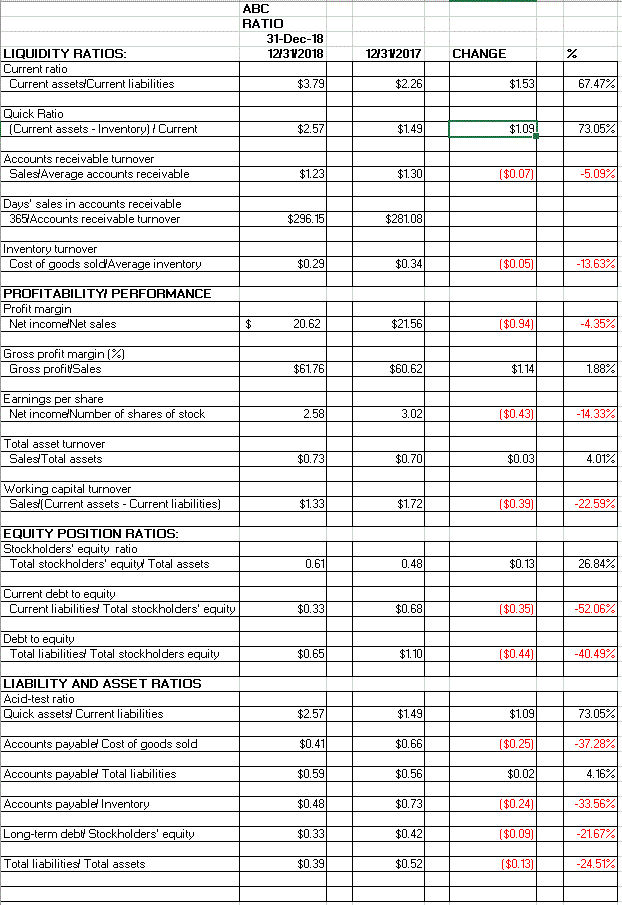
- Based on the ratio worksheet analysis, indicate at least three ratio areas where you can identify that liability understatement fraud may have occurred. Provide specific details in your paragraph explanation of each ratio, including horizontal and/or vertical analysis changes that support the concerns raised by the selected ratios.
- Based on the ratio worksheet analysis, indicate at least 3 ratio areas where you can identify that asset overstatement fraud may have occurred. Provide specific details in your paragraph explanation of each ratio, including horizontal and/or vertical analysis changes that support the concerns raised by the selected ratios.
- Based on the ratio worksheet analysis, indicate at least three ratio areas where you can identify revenue fraud may have occurred. Provide specific details in your paragraph explanation of each ratio, including horizontal and/or vertical analysis changes that support the concerns raised by the selected ratios.
- Based on the ratio worksheet analysis, indicate at least three areas where you can identify inventory fraud may have occurred. Provide specific details in your paragraph explanation of each ratio, including horizontal and/or vertical analysis changes that support the concerns raised by the selected ratios
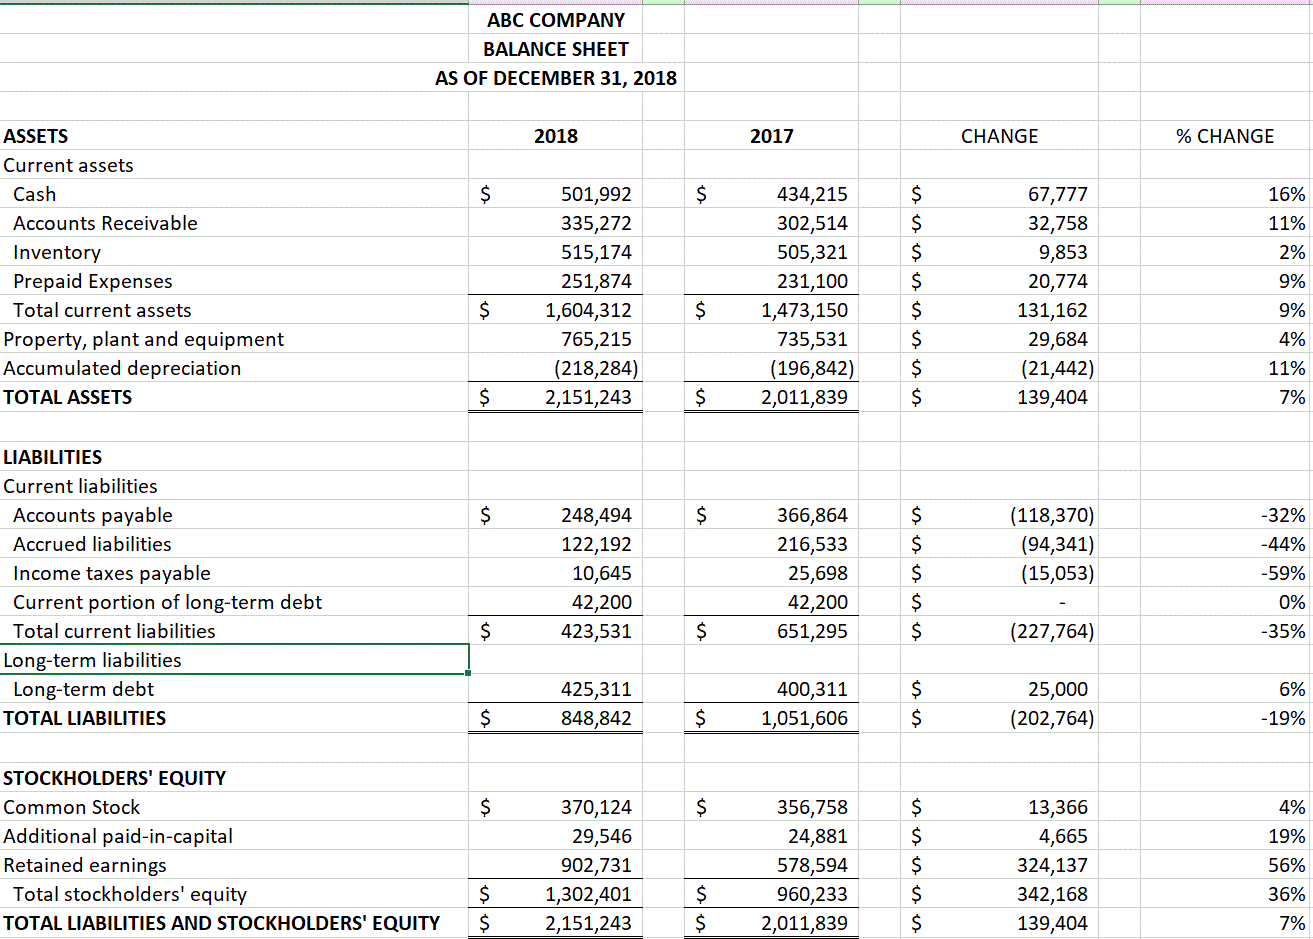
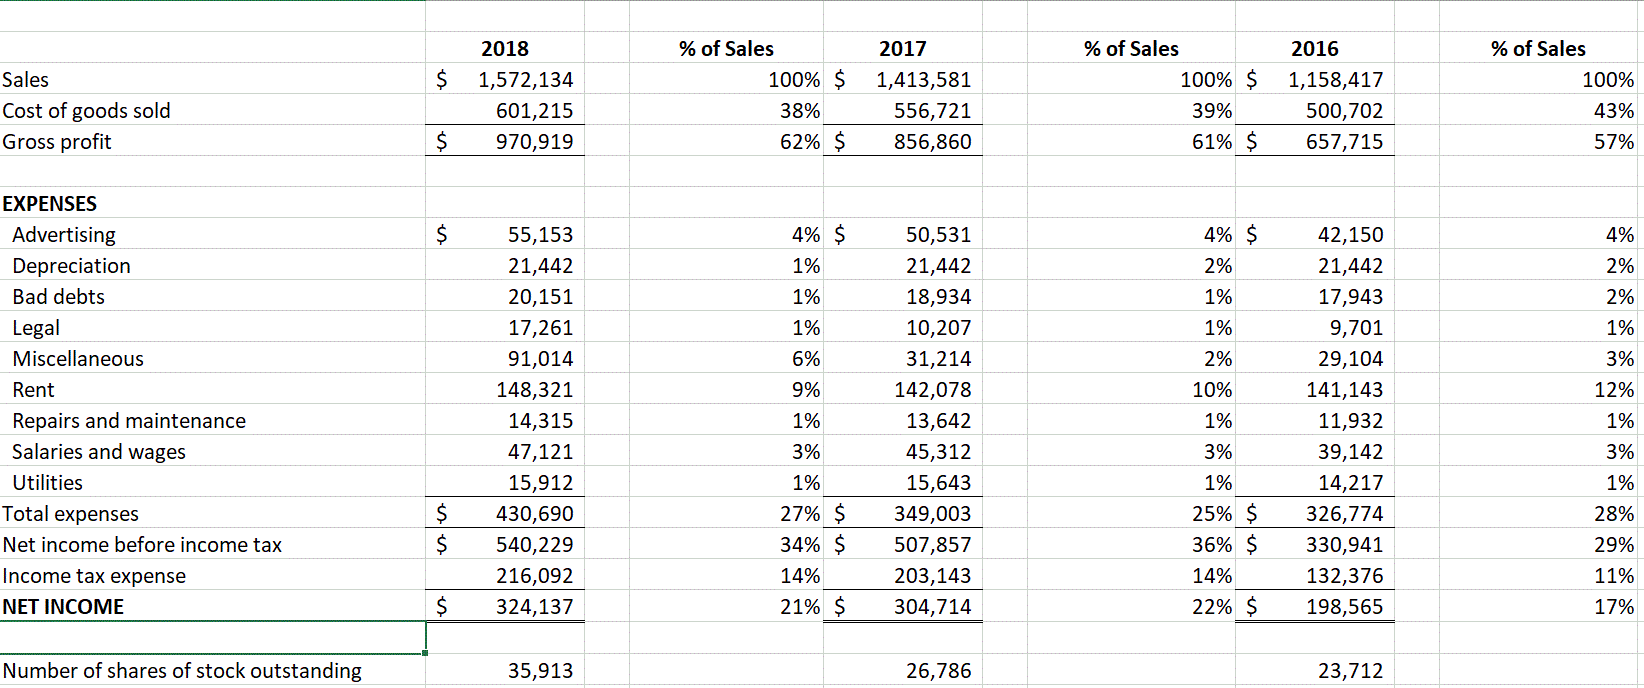
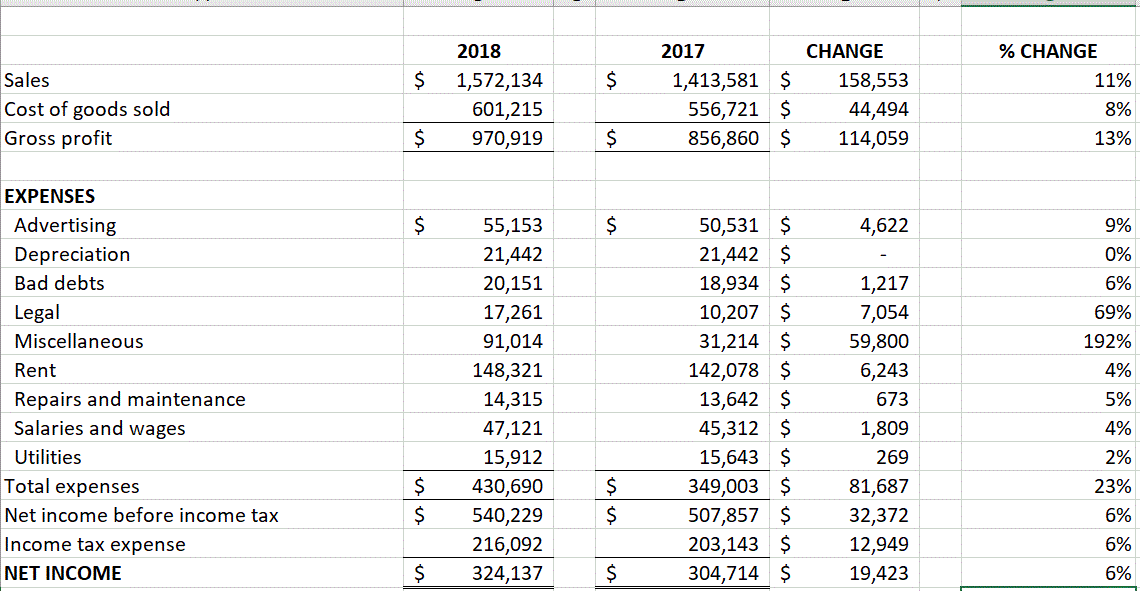
ABC COMPANY BALANCE SHEET AS OF DECEMBER 31, 2018 ASSETS 2018 2017 2016 Current assets Cash $ $ $ Accounts Receivable 501,992 335,272 515,174 251,874 1,604,312 765,215 (218,284) 2,151,243 434,215 302,514 505,321 231,100 1,473,150 735,531 (196,842) 2,011,839 375,141 241,764 310,885 136,388 1,064,178 705,132 (175,400) 1,593,910 Inventory Prepaid Expenses Total current assets Property, plant and equipment Accumulated depreciation TOTAL ASSETS $ $ $ $ $ $ LIABILITIES Current liabilities $ $ Accounts payable Accrued liabilities Income taxes payable Current portion of long-term debt Total current liabilities Long-term liabilities Long-term debt TOTAL LIABILITIES 248,494 122,192 10,645 42,200 423,531 366,864 216,533 25,698 42,200 651,295 322,156 215,474 22,349 42,200 602,179 $ $ $ 425,311 848,842 400,311 1,051,606 375,100 977,279 $ $ $ STOCKHOLDERS' EQUITY Common Stock $ $ $ Additional paid-in-capital Retained earnings Total stockholders' equity TOTAL LIABILITIES AND STOCKHOLDERS' EQUITY 370,124 29,546 902,731 1,302,401 2,151,243 356,758 24,881 578,594 960,233 2,011,839 320,841 21,910 273,880 616,631 1,593,910 $ $ $ $ $ $ ABC COMPANY INCOME STATEMENT FOR THE PERIOD ENDED DECEMBER 31, 2018 2018 2017 2016 $ $ $ Sales Cost of goods sold Gross profit 1,572,134 601,215 970,919 1,413,581 556,721 856,860 1,158,417 500,702 657,715 $ $ $ $ $ $ $ $ EXPENSES Advertising Depreciation Bad debts Legal Miscellaneous Rent Repairs and maintenance 55,153 21,442 20,151 17,261 91,014 148,321 14,315 47,121 15,912 430,690 540,229 216,092 324,137 50,531 21,442 18,934 10,207 31,214 142,078 13,642 45,312 15,643 349,003 507,857 203,143 304,714 42,150 21,442 17,943 9,701 29,104 141,143 11,932 39,142 14,217 326,774 330,941 132,376 198,565 Salaries and wages Utilities $ $ $ $ $ $ Total expenses Net income before income tax Income tax expense NET INCOME $ $ $ Number of shares of stock outstanding 35,913 26,786 23,712 ABC RATIO 31-Dec-18 121312018 12/312017 CHANGE % LIQUIDITY RATIOS: Current ratio Current assets Current liabilities $3.79 $2.26 $1.53 67.47% Quick Ratio (Current assets - Inventory) / Current $2.57 $1.491 $1.091 73.05% Accounts receivable turnover Sales/Average accounts receivable $1.23 $1.30 ($0.07) -5.09% Days' sales in accounts receivable 365/Accounts receivable turnover $296.15 $281.08 Inventory turnover Cost of goods sold'Average inventory $0.29 $0.34 ($0.05) -13.63% PROFITABILITY PERFORMANCE Profit margin Net income Net sales $ 20.62 $21.56 ($0.94) -4.35% Gross profit margin (4 Gross profillSales $61.76 $60.62 $1.14 1.88% Earnings per share Net income Number of shares of stock 2.58 3.02 ($0.43) -14.33% Total asset turnover Sales/Total assets $0.73 $0.70 $0.03 4.01% Working capital turnover Salest(Current assets - Current liabilities] $1.33 $1.72 ($0.39) -22.59% EQUITY POSITION RATIOS: Stockholders' equity ratio Total stockholders' equity Total assets 0.61 0.48 $0.13 26.84% Current debt to equity Current liabilities! Total stockholders' equity $0.33 $0.68 ($0.35) -52.06% Debt to equity Total liabilities/ Total stockholders equity $0.65 $110 ($0.44) -40.49% LIABILITY AND ASSET RATIOS Acid-test ratio Quick assets. Current liabilities $2.57 $1.491 $1.09 73.05% Accounts payable Cost of goods sold $0.41 $0.66 ($0.25) -37.28% Accounts payable/ Total liabilities $0.59 $0.56 $0.02 4.16% Accounts payable Inventory $0.48 $0.73) ($0.24) -33.56% Long-term debt Stockholders' equity $0.33 $0.42 ($0.09) -21.67% Total liabilities/ Total assets $0.39 $0.52 ($0.13) -24.51% ABC COMPANY BALANCE SHEET AS OF DECEMBER 31, 2018 ASSETS 2018 % TOTAL ASSETS 2017 % TOTAL ASSETS 2016 % TOTAL ASSETS Current assets Cash $ 23% $ 22% $ 24% Accounts Receivable 16% 15% 15% 24% 25% 20% 12% 11% 9% 501,992 335,272 515,174 251,874 1,604,312 765,215 (218,284) 2,151,243 434,215 302,514 505,321 231,100 1,473,150 735,531 (196,842) 2,011,839 375,141 241,764 310,885 136,388 1,064,178 705,132 (175,400) 1,593,910 $ 75% $ Inventory Prepaid Expenses Total current assets Property, plant and equipment Accumulated depreciation TOTAL ASSETS 73% $ 67% 36% 37% 44% -10% -10% -11% $ 100% $ 100% $ 100% LIABILITIES Current liabilities $ 29% $ 35% $ 33% 14% 21% 22% Accounts payable Accrued liabilities Income taxes payable Current portion of long-term debt Total current liabilities 248,494 122,192 10,645 42,200 423,531 1% 366,864 216,533 25,698 42,200 651,295 2% 322,156 215,474 22,349 42,200 602,179 4% 5% 4% 4% $ 50% $ 62% $ 62% Long-term liabilities Long-term debt 50% 38% 38% 425,311 848,842 400,311 1,051,606 375,100 977,279 TOTAL LIABILITIES $ 100% $ 100% $ 100% STOCKHOLDERS' EQUITY Common Stock $ 17% $ 18% $ 20% 1% 1% 1% Additional paid-in-capital Retained earnings Total stockholders' equity 370,124 29,546 902,731 1,302,401 2,151,243 42% 356,758 24,881 578,594 960,233 2,011,839 60% 320,841 21,910 273,880 616,631 1,593,910 17% 61% 48% 39% $ $ $ $ $ $ TOTAL LIABILITIES AND STOCKHOLDERS' EQUITY 100% 100% 100% ABC COMPANY BALANCE SHEET AS OF DECEMBER 31, 2018 ASSETS 2018 2017 CHANGE % CHANGE Current assets Cash $ $ $ 16% Accounts Receivable $ 11% 2% 9% Inventory Prepaid Expenses Total current assets Property, plant and equipment Accumulated depreciation 501,992 335,272 515,174 251,874 1,604,312 765,215 (218,284) 2,151,243 434,215 302,514 505,321 231,100 1,473,150 735,531 (196,842) 2,011,839 67,777 32,758 9,853 20,774 131,162 29,684 (21,442) 139,404 $ $ $ $ $ $ $ $ 9% 4% 11% TOTAL ASSETS $ $ 7% LIABILITIES Current liabilities $ $ -32% Accounts payable Accrued liabilities Income taxes payable Current portion of long-term debt Total current liabilities -44% 248,494 122,192 10,645 42,200 423,531 366,864 216,533 25,698 42,200 651,295 $ $ $ $ $ (118,370) (94,341) (15,053) -59% 0% $ $ (227,764) -35% Long-term liabilities Long-term debt 6% 425,311 848,842 400,311 1,051,606 $ $ 25,000 (202,764) TOTAL LIABILITIES $ $ -19% STOCKHOLDERS' EQUITY Common Stock $ $ 4% 19% Additional paid-in-capital Retained earnings Total stockholders' equity 370,124 29,546 902,731 1,302,401 2,151,243 356,758 24,881 578,594 960,233 2,011,839 $ $ $ $ $ 13,366 4,665 324,137 342,168 139,404 56% 36% $ $ $ $ TOTAL LIABILITIES AND STOCKHOLDERS' EQUITY 7% 2018 % of Sales 2017 % of Sales 2016 % of Sales Sales $ 1,572,134 100% $ 1,413,581 100% $ 1,158,417 100% 601,215 38% 556,721 39% 500,702 43% Cost of goods sold Gross profit $ 970,919 62% $ 856,860 61% $ 657,715 57% EXPENSES $ 55,153 4% $ 4% $ 42,150 4% 50,531 21,442 21,442 1% 2% 21,442 2% Advertising Depreciation Bad debts Legal Miscellaneous 1% 18,934 1% 17,943 2% 20,151 17,261 1% 10,207 1% 9,701 1% 91,014 6% 31,214 2% 3% 29,104 141,143 Rent 148,321 9% 142,078 10% 12% 14,315 1% 13,642 1% 1% Repairs and maintenance Salaries and wages Utilities 11,932 39,142 47,121 3% 3% 3% 15,912 1% 45,312 15,643 349,003 1% 14,217 1% Total expenses 430,690 326,774 28% $ $ 27% $ 34% $ 25% $ 36% $ Net income before income tax 540,229 507,857 330,941 29% Income tax expense 216,092 14% 203,143 14% 132,376 11% NET INCOME $ 324,137 21% $ 304,714 22% $ 198,565 17% Number of shares of stock outstanding 35,913 26,786 23,712 2018 2017 CHANGE % CHANGE $ $ 11% Sales Cost of goods sold Gross profit 1,572,134 601,215 970,919 1,413,581 $ 556,721 $ 856,860 $ 158,553 44,494 114,059 8% $ $ 13% EXPENSES $ $ 4,622 9% 0% Advertising Depreciation Bad debts Legal Miscellaneous 6% 69% 1,217 7,054 59,800 6,243 192% Rent 4% 55,153 21,442 20,151 17,261 91,014 148,321 14,315 47,121 15,912 430,690 540,229 216,092 324,137 50,531 $ 21,442 $ 18,934 $ 10,207 $ 31,214 $ 142,078 $ 13,642 $ 45,312 $ 15,643 $ 349,003 $ 507,857 $ 203,143 $ 304,714 $ 673 5% 1,809 4% Repairs and maintenance Salaries and wages Utilities Total expenses Net income before income tax Income tax expense NET INCOME 269 2% $ 23% $ $ $ 6% 81,687 32,372 12,949 19,423 6% $ $ 6% ABC COMPANY BALANCE SHEET AS OF DECEMBER 31, 2018 ASSETS 2018 2017 2016 Current assets Cash $ $ $ Accounts Receivable 501,992 335,272 515,174 251,874 1,604,312 765,215 (218,284) 2,151,243 434,215 302,514 505,321 231,100 1,473,150 735,531 (196,842) 2,011,839 375,141 241,764 310,885 136,388 1,064,178 705,132 (175,400) 1,593,910 Inventory Prepaid Expenses Total current assets Property, plant and equipment Accumulated depreciation TOTAL ASSETS $ $ $ $ $ $ LIABILITIES Current liabilities $ $ Accounts payable Accrued liabilities Income taxes payable Current portion of long-term debt Total current liabilities Long-term liabilities Long-term debt TOTAL LIABILITIES 248,494 122,192 10,645 42,200 423,531 366,864 216,533 25,698 42,200 651,295 322,156 215,474 22,349 42,200 602,179 $ $ $ 425,311 848,842 400,311 1,051,606 375,100 977,279 $ $ $ STOCKHOLDERS' EQUITY Common Stock $ $ $ Additional paid-in-capital Retained earnings Total stockholders' equity TOTAL LIABILITIES AND STOCKHOLDERS' EQUITY 370,124 29,546 902,731 1,302,401 2,151,243 356,758 24,881 578,594 960,233 2,011,839 320,841 21,910 273,880 616,631 1,593,910 $ $ $ $ $ $ ABC COMPANY INCOME STATEMENT FOR THE PERIOD ENDED DECEMBER 31, 2018 2018 2017 2016 $ $ $ Sales Cost of goods sold Gross profit 1,572,134 601,215 970,919 1,413,581 556,721 856,860 1,158,417 500,702 657,715 $ $ $ $ $ $ $ $ EXPENSES Advertising Depreciation Bad debts Legal Miscellaneous Rent Repairs and maintenance 55,153 21,442 20,151 17,261 91,014 148,321 14,315 47,121 15,912 430,690 540,229 216,092 324,137 50,531 21,442 18,934 10,207 31,214 142,078 13,642 45,312 15,643 349,003 507,857 203,143 304,714 42,150 21,442 17,943 9,701 29,104 141,143 11,932 39,142 14,217 326,774 330,941 132,376 198,565 Salaries and wages Utilities $ $ $ $ $ $ Total expenses Net income before income tax Income tax expense NET INCOME $ $ $ Number of shares of stock outstanding 35,913 26,786 23,712 ABC RATIO 31-Dec-18 121312018 12/312017 CHANGE % LIQUIDITY RATIOS: Current ratio Current assets Current liabilities $3.79 $2.26 $1.53 67.47% Quick Ratio (Current assets - Inventory) / Current $2.57 $1.491 $1.091 73.05% Accounts receivable turnover Sales/Average accounts receivable $1.23 $1.30 ($0.07) -5.09% Days' sales in accounts receivable 365/Accounts receivable turnover $296.15 $281.08 Inventory turnover Cost of goods sold'Average inventory $0.29 $0.34 ($0.05) -13.63% PROFITABILITY PERFORMANCE Profit margin Net income Net sales $ 20.62 $21.56 ($0.94) -4.35% Gross profit margin (4 Gross profillSales $61.76 $60.62 $1.14 1.88% Earnings per share Net income Number of shares of stock 2.58 3.02 ($0.43) -14.33% Total asset turnover Sales/Total assets $0.73 $0.70 $0.03 4.01% Working capital turnover Salest(Current assets - Current liabilities] $1.33 $1.72 ($0.39) -22.59% EQUITY POSITION RATIOS: Stockholders' equity ratio Total stockholders' equity Total assets 0.61 0.48 $0.13 26.84% Current debt to equity Current liabilities! Total stockholders' equity $0.33 $0.68 ($0.35) -52.06% Debt to equity Total liabilities/ Total stockholders equity $0.65 $110 ($0.44) -40.49% LIABILITY AND ASSET RATIOS Acid-test ratio Quick assets. Current liabilities $2.57 $1.491 $1.09 73.05% Accounts payable Cost of goods sold $0.41 $0.66 ($0.25) -37.28% Accounts payable/ Total liabilities $0.59 $0.56 $0.02 4.16% Accounts payable Inventory $0.48 $0.73) ($0.24) -33.56% Long-term debt Stockholders' equity $0.33 $0.42 ($0.09) -21.67% Total liabilities/ Total assets $0.39 $0.52 ($0.13) -24.51% ABC COMPANY BALANCE SHEET AS OF DECEMBER 31, 2018 ASSETS 2018 % TOTAL ASSETS 2017 % TOTAL ASSETS 2016 % TOTAL ASSETS Current assets Cash $ 23% $ 22% $ 24% Accounts Receivable 16% 15% 15% 24% 25% 20% 12% 11% 9% 501,992 335,272 515,174 251,874 1,604,312 765,215 (218,284) 2,151,243 434,215 302,514 505,321 231,100 1,473,150 735,531 (196,842) 2,011,839 375,141 241,764 310,885 136,388 1,064,178 705,132 (175,400) 1,593,910 $ 75% $ Inventory Prepaid Expenses Total current assets Property, plant and equipment Accumulated depreciation TOTAL ASSETS 73% $ 67% 36% 37% 44% -10% -10% -11% $ 100% $ 100% $ 100% LIABILITIES Current liabilities $ 29% $ 35% $ 33% 14% 21% 22% Accounts payable Accrued liabilities Income taxes payable Current portion of long-term debt Total current liabilities 248,494 122,192 10,645 42,200 423,531 1% 366,864 216,533 25,698 42,200 651,295 2% 322,156 215,474 22,349 42,200 602,179 4% 5% 4% 4% $ 50% $ 62% $ 62% Long-term liabilities Long-term debt 50% 38% 38% 425,311 848,842 400,311 1,051,606 375,100 977,279 TOTAL LIABILITIES $ 100% $ 100% $ 100% STOCKHOLDERS' EQUITY Common Stock $ 17% $ 18% $ 20% 1% 1% 1% Additional paid-in-capital Retained earnings Total stockholders' equity 370,124 29,546 902,731 1,302,401 2,151,243 42% 356,758 24,881 578,594 960,233 2,011,839 60% 320,841 21,910 273,880 616,631 1,593,910 17% 61% 48% 39% $ $ $ $ $ $ TOTAL LIABILITIES AND STOCKHOLDERS' EQUITY 100% 100% 100% ABC COMPANY BALANCE SHEET AS OF DECEMBER 31, 2018 ASSETS 2018 2017 CHANGE % CHANGE Current assets Cash $ $ $ 16% Accounts Receivable $ 11% 2% 9% Inventory Prepaid Expenses Total current assets Property, plant and equipment Accumulated depreciation 501,992 335,272 515,174 251,874 1,604,312 765,215 (218,284) 2,151,243 434,215 302,514 505,321 231,100 1,473,150 735,531 (196,842) 2,011,839 67,777 32,758 9,853 20,774 131,162 29,684 (21,442) 139,404 $ $ $ $ $ $ $ $ 9% 4% 11% TOTAL ASSETS $ $ 7% LIABILITIES Current liabilities $ $ -32% Accounts payable Accrued liabilities Income taxes payable Current portion of long-term debt Total current liabilities -44% 248,494 122,192 10,645 42,200 423,531 366,864 216,533 25,698 42,200 651,295 $ $ $ $ $ (118,370) (94,341) (15,053) -59% 0% $ $ (227,764) -35% Long-term liabilities Long-term debt 6% 425,311 848,842 400,311 1,051,606 $ $ 25,000 (202,764) TOTAL LIABILITIES $ $ -19% STOCKHOLDERS' EQUITY Common Stock $ $ 4% 19% Additional paid-in-capital Retained earnings Total stockholders' equity 370,124 29,546 902,731 1,302,401 2,151,243 356,758 24,881 578,594 960,233 2,011,839 $ $ $ $ $ 13,366 4,665 324,137 342,168 139,404 56% 36% $ $ $ $ TOTAL LIABILITIES AND STOCKHOLDERS' EQUITY 7% 2018 % of Sales 2017 % of Sales 2016 % of Sales Sales $ 1,572,134 100% $ 1,413,581 100% $ 1,158,417 100% 601,215 38% 556,721 39% 500,702 43% Cost of goods sold Gross profit $ 970,919 62% $ 856,860 61% $ 657,715 57% EXPENSES $ 55,153 4% $ 4% $ 42,150 4% 50,531 21,442 21,442 1% 2% 21,442 2% Advertising Depreciation Bad debts Legal Miscellaneous 1% 18,934 1% 17,943 2% 20,151 17,261 1% 10,207 1% 9,701 1% 91,014 6% 31,214 2% 3% 29,104 141,143 Rent 148,321 9% 142,078 10% 12% 14,315 1% 13,642 1% 1% Repairs and maintenance Salaries and wages Utilities 11,932 39,142 47,121 3% 3% 3% 15,912 1% 45,312 15,643 349,003 1% 14,217 1% Total expenses 430,690 326,774 28% $ $ 27% $ 34% $ 25% $ 36% $ Net income before income tax 540,229 507,857 330,941 29% Income tax expense 216,092 14% 203,143 14% 132,376 11% NET INCOME $ 324,137 21% $ 304,714 22% $ 198,565 17% Number of shares of stock outstanding 35,913 26,786 23,712 2018 2017 CHANGE % CHANGE $ $ 11% Sales Cost of goods sold Gross profit 1,572,134 601,215 970,919 1,413,581 $ 556,721 $ 856,860 $ 158,553 44,494 114,059 8% $ $ 13% EXPENSES $ $ 4,622 9% 0% Advertising Depreciation Bad debts Legal Miscellaneous 6% 69% 1,217 7,054 59,800 6,243 192% Rent 4% 55,153 21,442 20,151 17,261 91,014 148,321 14,315 47,121 15,912 430,690 540,229 216,092 324,137 50,531 $ 21,442 $ 18,934 $ 10,207 $ 31,214 $ 142,078 $ 13,642 $ 45,312 $ 15,643 $ 349,003 $ 507,857 $ 203,143 $ 304,714 $ 673 5% 1,809 4% Repairs and maintenance Salaries and wages Utilities Total expenses Net income before income tax Income tax expense NET INCOME 269 2% $ 23% $ $ $ 6% 81,687 32,372 12,949 19,423 6% $ $ 6%


