

Question
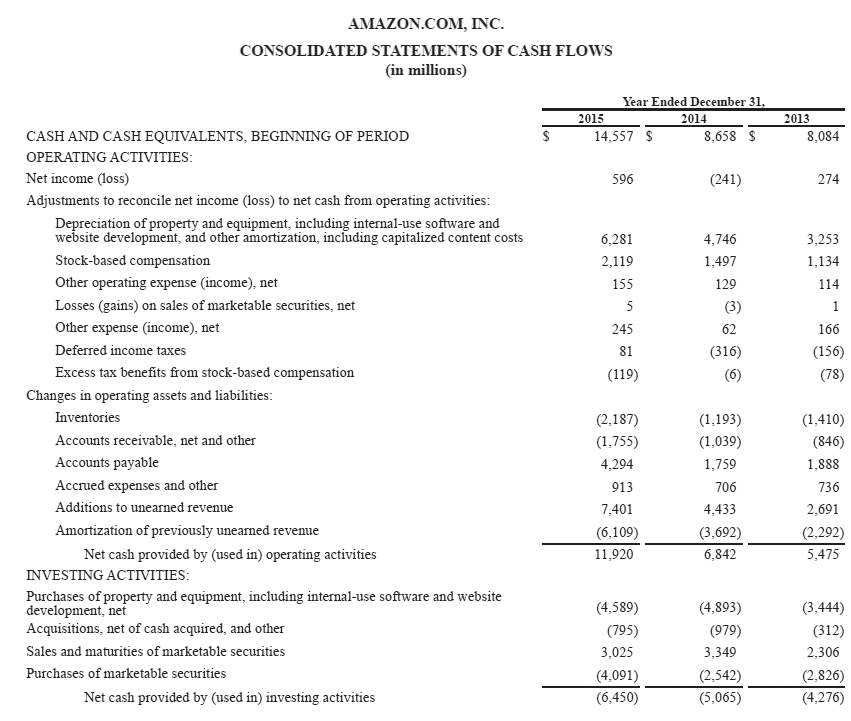
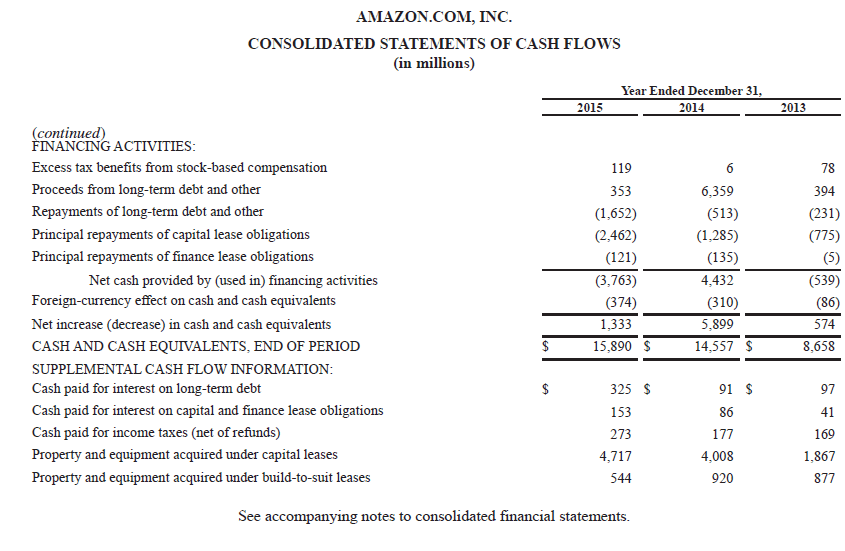
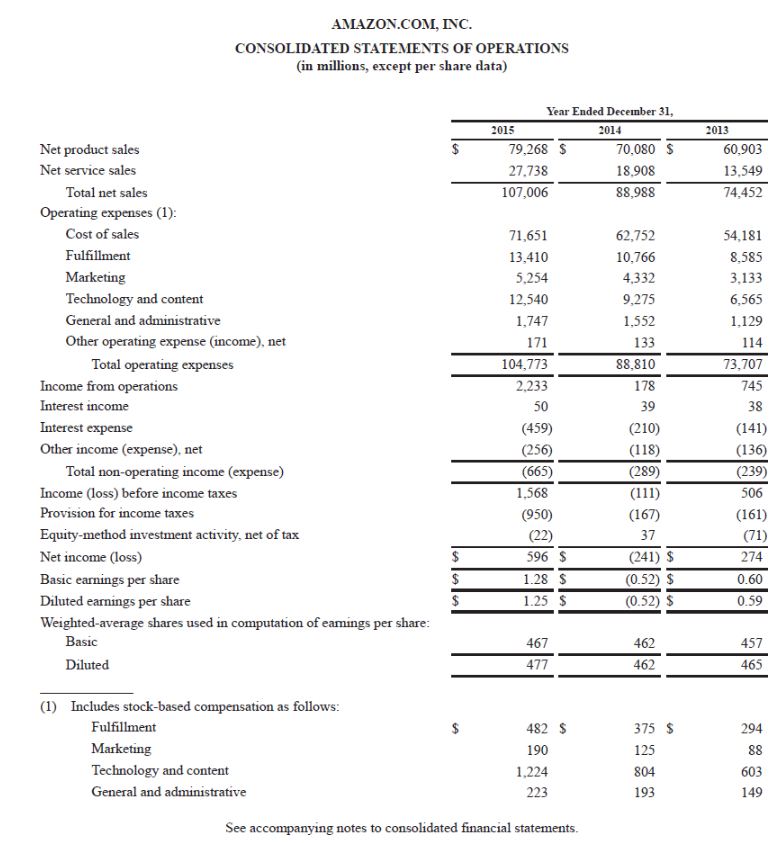
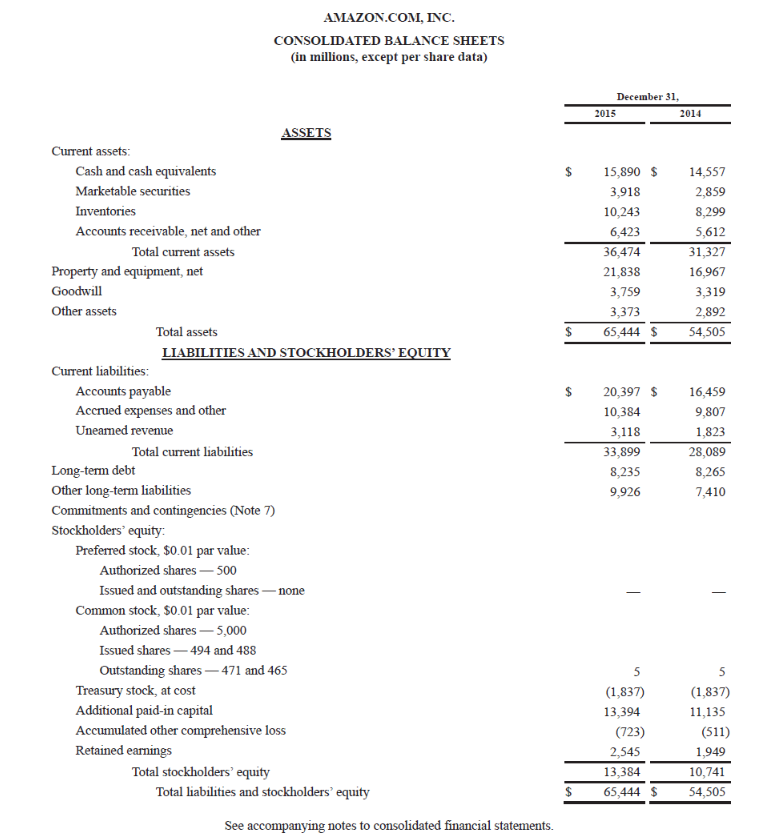
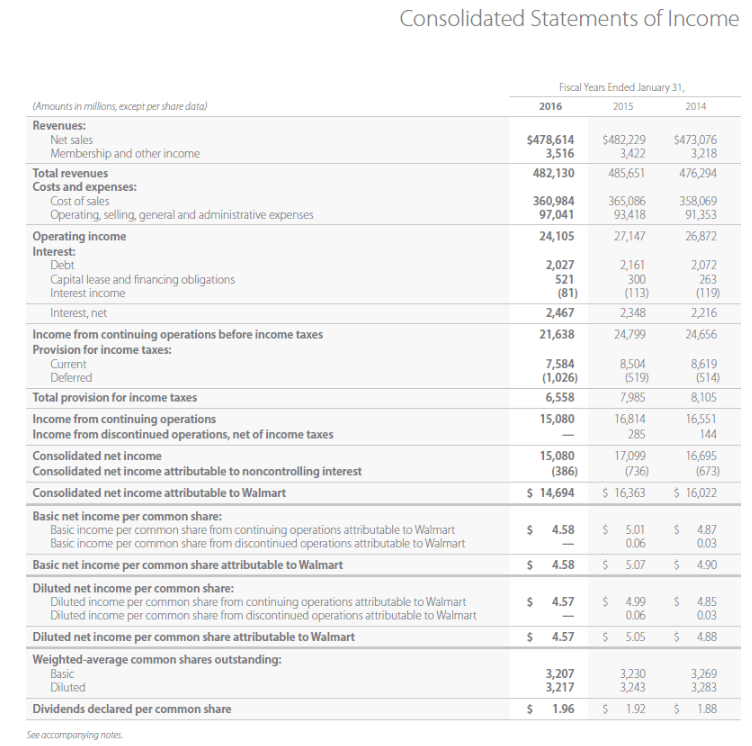
Based on the information contained in these financial statements, determine each of the following for each company. Use Amazons net product sales to compute gross
Based on the information contained in these financial statements, determine each of the following for each company. Use Amazons net product sales to compute gross profit information
| Amazon Year ended Dec 31, 2015 | Walmart Year ended Jan 31, 2016 | |
|---|---|---|
| Gross Profit | ||
| Gross Profit Rate (%) | ||
| Operating Income | ||
| Percentage change in Operating Income from 2014 to 2015 ( %, Increase,Decrease |
Step by Step Solution
There are 3 Steps involved in it
Step: 1

Get Instant Access to Expert-Tailored Solutions
See step-by-step solutions with expert insights and AI powered tools for academic success
Step: 2

Step: 3
Ace Your Homework with AI
Get the answers you need in no time with our AI-driven, step-by-step assistance
Get Started
Intermediate Accounting
Authors: Loren A Nikolai, D. Bazley and Jefferson P. Jones
10th Edition
324300980, 978-0324300987