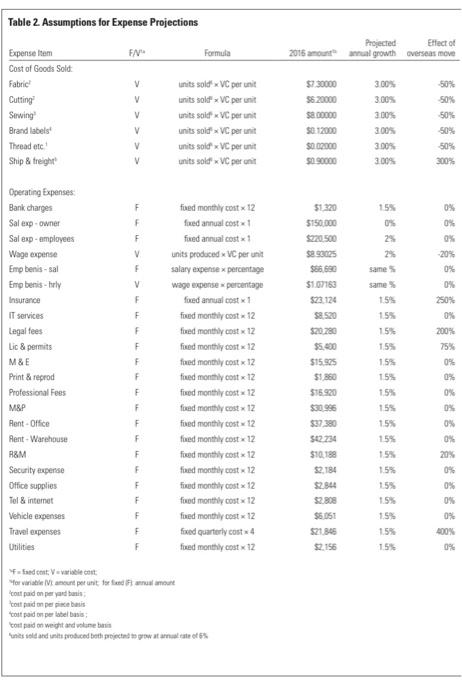
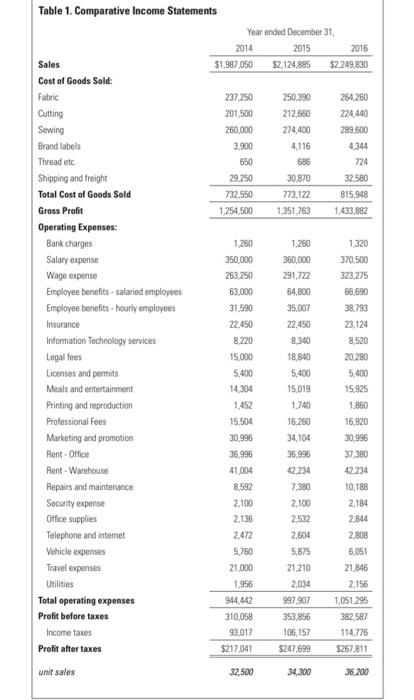
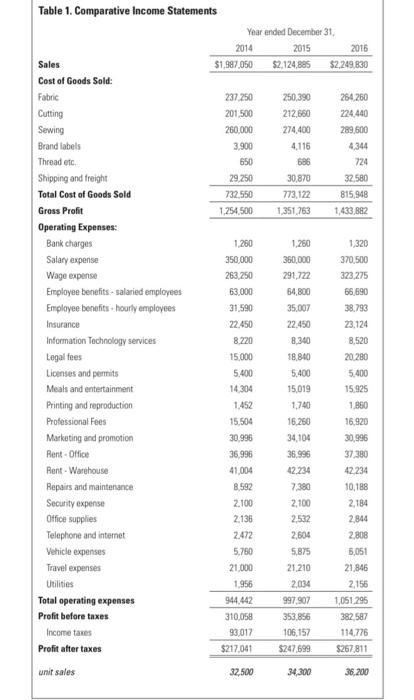
Based on the information presented in Tables 1 and 2, calculate the number of unit sales required to (a) break even and (b) reach the target profit that achieves Rossi's profitability goal. Using Riley's projected growth rates (Table 2), prepare a pro forma income statement for the year 2017 Based on your answer to Question 2, what would be the net cash paid or available to the owner? Assuming FDI continues all production in North America, and using Riley's projected growth rates (Table 2), how long would it take to achieve Rossi's profitability goal? Assuming that FDI decides to move all manufacturing overseas, and using Riley's expected changes in costs from this move and projected growth rates (Table 2). prepare a pro forma income statement for the year 2017. Based on your answer to Question 5, what would be the net cash paid or available to the owner? Assuming that FDI decides to move its production overseas, and using Riley's expected changes in costs from such a change in manufacturing and projected growth rates (Table 2), how long would it take to achieve Rossi's profitability goal? What do you think FDI should do with its production: continue in North America or move it overseas? Discuss the quantitative, qualitative, and ethical factors, if any, that come into play with this decision. Sales Table 1. Comparative Income Statements Year ended December 31 2014 2015 2016 $1,907,050 $2,124,805 $2,249,830 Cost of Goods Sold: Fabric 237.250 250,390 254.260 Cutting 201,500 212,660 224.440 Sewing 260.000 274.400 289.500 Brand labels 3.900 4,115 4,344 Thread etc 650 686 724 Shipping and freight 29.250 30.870 32.580 Total Cost of Goods Sold 732.550 773,122 815,948 Gross Profit 1.254.500 1,351,753 1.433 882 Operating Expenses Bank charges 1.260 1.260 1.320 Salary expense 350,000 360,000 370,500 Wage expense 263.250 291,722 323 275 Employee benefits - salaried employees 63.000 64.800 66,690 Employee benefits-hourly employees 31.590 35.007 38.793 Insurance 22.450 22.450 23.124 Information Technology services 8.220 8.340 8.520 Legal fees 15,000 18,840 20 280 Licenses and permits 5.400 5,400 5.400 Meals and entertainment 14.304 15,019 15.925 Printing and reproduction 1.452 1.740 1.860 Professional Fees 15.504 16.260 16.920 Marketing and promotion 30.996 34,104 30.996 Rent - Office 36,996 36,996 37380 Rent - Warehouse 41,004 42.234 42.234 Repairs and maintenance 8.592 7,380 10,188 Security expense 2.100 2,100 2.184 Office supplies 2.136 2532 2,844 Telephone and internet 2.472 2,604 2,808 Vehicle expenses 5.780 5.875 5,051 Travel expenses 21.000 21.210 21,846 Utilities 1956 2.034 2,156 Total operating expenses 944.442 997.907 1,051,295 Profit before taxes 310,058 353.856 382 587 Income taxes 93,017 106,157 114,776 Profit after taxes $217,041 $247,699 $267.811 unit sales 32,500 34.300 36,200 Based on the information presented in Tables 1 and 2, calculate the number of unit sales required to (a) break even and (b) reach the target profit that achieves Rossi's profitability goal. Using Riley's projected growth rates (Table 2), prepare a pro forma income statement for the year 2017 Based on your answer to Question 2, what would be the net cash paid or available to the owner? Assuming FDI continues all production in North America, and using Riley's projected growth rates (Table 2), how long would it take to achieve Rossi's profitability goal? Assuming that FDI decides to move all manufacturing overseas, and using Riley's expected changes in costs from this move and projected growth rates (Table 2). prepare a pro forma income statement for the year 2017. Based on your answer to Question 5, what would be the net cash paid or available to the owner? Assuming that FDI decides to move its production overseas, and using Riley's expected changes in costs from such a change in manufacturing and projected growth rates (Table 2), how long would it take to achieve Rossi's profitability goal? What do you think FDI should do with its production: continue in North America or move it overseas? Discuss the quantitative, qualitative, and ethical factors, if any, that come into play with this decision. Sales Table 1. Comparative Income Statements Year ended December 31 2014 2015 2016 $1,907,050 $2,124,805 $2,249,830 Cost of Goods Sold: Fabric 237.250 250,390 254.260 Cutting 201,500 212,660 224.440 Sewing 260.000 274.400 289.500 Brand labels 3.900 4,115 4,344 Thread etc 650 686 724 Shipping and freight 29.250 30.870 32.580 Total Cost of Goods Sold 732.550 773,122 815,948 Gross Profit 1.254.500 1,351,753 1.433 882 Operating Expenses Bank charges 1.260 1.260 1.320 Salary expense 350,000 360,000 370,500 Wage expense 263.250 291,722 323 275 Employee benefits - salaried employees 63.000 64.800 66,690 Employee benefits-hourly employees 31.590 35.007 38.793 Insurance 22.450 22.450 23.124 Information Technology services 8.220 8.340 8.520 Legal fees 15,000 18,840 20 280 Licenses and permits 5.400 5,400 5.400 Meals and entertainment 14.304 15,019 15.925 Printing and reproduction 1.452 1.740 1.860 Professional Fees 15.504 16.260 16.920 Marketing and promotion 30.996 34,104 30.996 Rent - Office 36,996 36,996 37380 Rent - Warehouse 41,004 42.234 42.234 Repairs and maintenance 8.592 7,380 10,188 Security expense 2.100 2,100 2.184 Office supplies 2.136 2532 2,844 Telephone and internet 2.472 2,604 2,808 Vehicle expenses 5.780 5.875 5,051 Travel expenses 21.000 21.210 21,846 Utilities 1956 2.034 2,156 Total operating expenses 944.442 997.907 1,051,295 Profit before taxes 310,058 353.856 382 587 Income taxes 93,017 106,157 114,776 Profit after taxes $217,041 $247,699 $267.811 unit sales 32,500 34.300 36,200


