***BASED ON THE INFORMATION PROVIDED, PLEASE ANSWER QUESTIONS #5. PLEASE SHOW ALL WORK AND CELL CONTENTS WHEN USING EXCEL. THANKS A TON!***
The Dilemma at Day-Pro
The Day-Pro Chemical Corporation, established in 1995, has managed to earn a consistently high rate of return on its investment. The secret of its success has been the strategic and timely development, manufacturing, and marketing of innovative chemical products that have been used in various industries. Currently, the management of the company is considering the manufacture of a thermosetting resin as packaging material for electrical products. The Companys Research and Development teams have come up with two alternatives: an epoxy resin, which would have a lower startup cost, and a synthetic resin, which would cost more to produce initially but would have greater economies of scale. At the initial presentation, the project leaders of both teams presented their cash flow projections and provided sufficient documentation in support of their proposal. However, since the products are mutually exclusive, the firm can only fund one proposal.
In order to resolve this dilemma, Tim Palmer, the Assistant Treasurer, and a recent MBA from a prestigious mid-western university, has been assigned the task of analyzing the costs of benefits of the two proposals and presenting his findings to the board of directors. Tim knows that this will be an uphill task, since the board members are not at all on the same page when it comes to financial concepts. The Board has historically had a strong preference for using rates of return as its decision criteria. On occasions it has also used the payback period approach to decide between competing projects. However, Tim is convinced that the net present value (NPV) method is least flawed and when used correctly will always add the most value to a companys wealth.
After obtaining the cash flow projections for each project (See Table 1 & 2) and crunching out the numbers, Tim realizes that the hill is going to be steeper than he though. The various capital budgeting techniques, when applied to the two series of cash flows, provide inconsistent results. The project with higher NPV has a longer payback and lower internal rate of return (IRR). Tim scratches his head, wondering how he can convince the Board that the IRR and payback period can often lead to incorrect decisions.


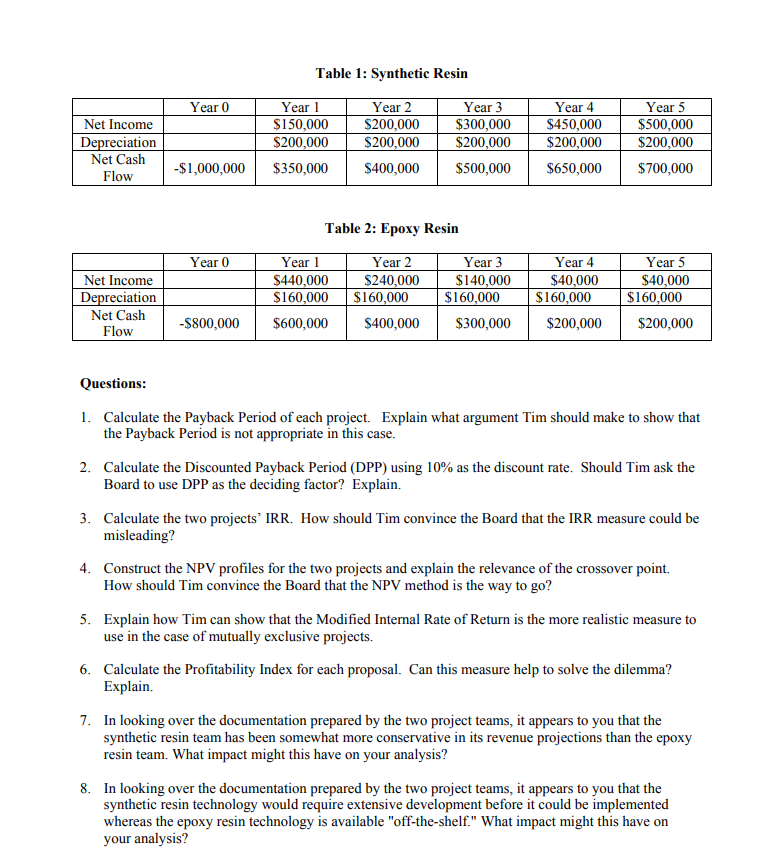
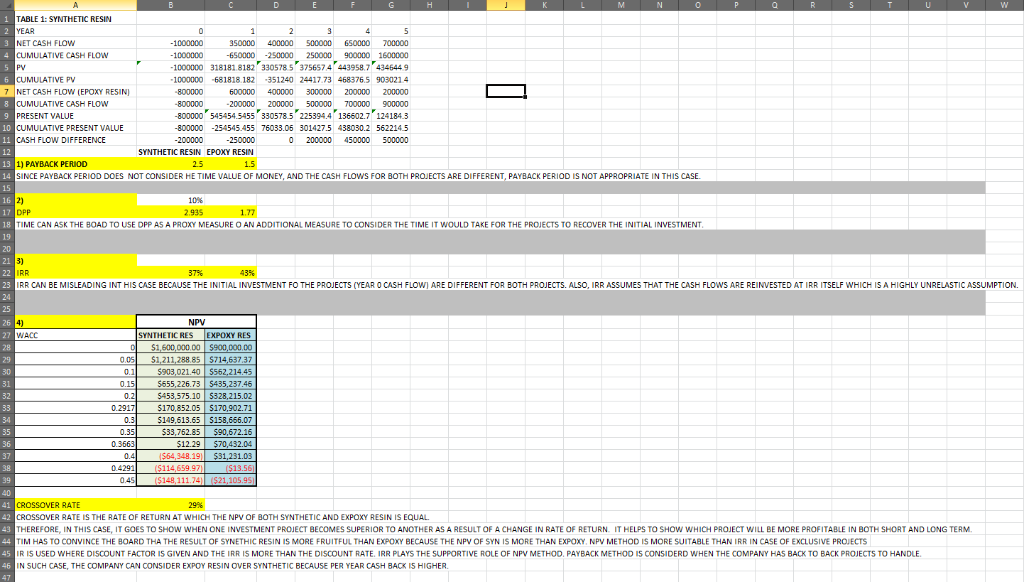
Table 1: Synthetic Resin Year 0 Year 2 S200,000 S200,000 S400,000 Year 4 S300,000 $450,000$500,000 S200,000 $200,000$200,000 S500,000 S650,000$700,000 Year 3 ear S150,000 S200,000 ear Net Income ation Net Cash$ $1,000,000 $350,000 Flow Table 2: Epoxy Resin Year 2 $240,000 Year 3 $140,000 Year 4 $40,000 ear ear S440,000 $160,000 $160,000 ear Net Income $40,000 ciation S160,000 $160,000 $160,000 Net Cash Flow -$800,000$600,000 S400,000 S300,000 $200,000$200,000 Questions: 1. Calculate the Payback Period of each project. Explain what argument Tim should make to show that the Payback Period is not appropriate in t his case 2. Calculate the Discounted Payback Period (DPP) using 10% as the discount rate. Should Tim ask the Board to use DPP as the deciding factor? Explain. 3. Calculate the two projects' IRR. How should Tim convince the Board that the IRR measure could be misleading? 4. Construct the NPV profiles for the two projects and explain the relevance of the crossover point. How should Tim convince the Board that the NPV method is the way to go? 5. Explain how Tim can show that the Modified Internal Rate of Return is the more realistic measure to use in the case of mutually exclusive projects. 6. Calculate the Profitability Index for each proposal. Can this measure help to solve the dilemma? Explain. 7. In looking over the documentation prepared by the two project teams, it appears to you that the synthetic resin team has been somewhat more conservative in its revenue projections than the epoxy resin team. What impact might this have on your analysis? 8. In looking over the documentation prepared by the two project teams, it appears to you that the synthetic resin technology would require extensive development before it could be implemented whereas the epoxy resin technology is available "off-the-shelf." What impact might this have on your analysis? TABLE 1: SYNTHETIC RESIN NET CASH FLOV CUMULATIVE CASH FLOW PV CUMULATIVE PV 50000 400000 500000 650000 700000 650000 -250000 250000 900000 1600000 000000 318181.8182 330578 5 3756574 443958.7 4346449 1000000 681818.182351240 24417.73 468376.5 9030214 600000 400000 300000 200000 200000 200000 200000 500000 700000 900000 800000 545454.5455 330578 5 225394.4 136602.7 124184.3 800000 -254545.455 76033.05 301427.5 438030.2 562214 5 0 200000 450000 500000 1000000 7 NET CASH FLOW (EPOXY RESIN CUMULATIVE CASH FLOW PRESENT VALUE CUMULATIVE PRESENT VALUE CASH FLOW DIFFERENCE 800000 250000 SYNTHETIC RESIN EPOXY RESIN 1) PAYBACK PERIOD SINCE PAYBACK PERIOD DOES NOT CONSIDER HE TIME VALUE OF MONEY, AND THE CASH FLOWS FOR BOTH PROJECTS ARE DIFFERENT, PAYBACK PERIOD IS NOT APPROPRIATE IN THIS CASE 18 TIME CAN ASK THE BOAD TO USE DPP AS A PROXY MEASURE O AN ADDITIONAL MEASURE TO CONSIDER THE TIME IT WOULD TAKE FOR THE PROJECTS TO RECOVER THE INITIAL INVESTMENT IRR CAN BE MISLEADING INT HIS CASE BECAUSE THE INITIAL INVESTMENT FO THE PROJECTS (YEAR O CASH FLOWI ARE DIFFERENT FOR BOTH PROJECTS. ALSO, IRR ASSUMES THAT THE CASH FLOWS ARE REINVESTED AT IRR ITSELF WHICH IS A HIGHLY UNRELASTIC ASSUMPTION 25 WACC SYNTHETIC RES EXPOXY RES $1,600,000.00 $900,000.00 0 $1,211,288 851571463737 5903,02140 S562,214.45 55,226.73 5435,237.46 5453,575.10 5328,215.02 5170,852.05 5170,902.71 0.3$149,613.65 5158,656.07 533,762.85 590,672.16 512.29 570,432.04 30 31 0.291 0.35 0.3663 36 $64,348.1 0.4291 CROSSOVER RATE CROSSOVER RATE IS THE RATE OF RETURN AT WHICH THE NPV OF BOTH SYNTHETIC AND EXPOXY RESIN IS EQUAL THEREFORE, IN THIS CASE, IT GOES TO SHOW WHEN ONE INVESTMENT PROJECT BECOMES SUPERIOR TO ANOTHER AS A RESULT OF A CHANGE IN RATE OF RETURN. IT HELPS TO SHOW WHICH PROJECT WILL BE MORE PROFITABLE IN BOTH SHORT AND LONG TERM IM HAS TO CONVINCE THE BOARD THA THE RESULT OF SYNETHIC RESIN IS MORE FRUITFUL THAN EXPOXY BECAUSE THE NPV OF SYN IS MORE THAN EXPOXY, NPV METHOD IS MORE SUITABLE THAN IRR IN CASE OF EXCLUSIVE PROJECTS IR I5 USED WHERE DISCOUNT FACTOR I5 GIVEN AND THE IRR IS MORE THAN THE DISCOUNT RATE. IRR PLAYS THE SUPPORTIVE ROLE OF NPV METHOO, PAYBACK METHOO IS CONSIDERD WHEN THE COMPANY HAS BACK TO BACK PROJECTS TO HANDLE IN SUCH CASE, THE COMPANY CAN CONSIDER EXPOY RESIN OVER SYNTHETIC BECAUSE PER YEAR CASH BACK HIGHER. Table 1: Synthetic Resin Year 0 Year 2 S200,000 S200,000 S400,000 Year 4 S300,000 $450,000$500,000 S200,000 $200,000$200,000 S500,000 S650,000$700,000 Year 3 ear S150,000 S200,000 ear Net Income ation Net Cash$ $1,000,000 $350,000 Flow Table 2: Epoxy Resin Year 2 $240,000 Year 3 $140,000 Year 4 $40,000 ear ear S440,000 $160,000 $160,000 ear Net Income $40,000 ciation S160,000 $160,000 $160,000 Net Cash Flow -$800,000$600,000 S400,000 S300,000 $200,000$200,000 Questions: 1. Calculate the Payback Period of each project. Explain what argument Tim should make to show that the Payback Period is not appropriate in t his case 2. Calculate the Discounted Payback Period (DPP) using 10% as the discount rate. Should Tim ask the Board to use DPP as the deciding factor? Explain. 3. Calculate the two projects' IRR. How should Tim convince the Board that the IRR measure could be misleading? 4. Construct the NPV profiles for the two projects and explain the relevance of the crossover point. How should Tim convince the Board that the NPV method is the way to go? 5. Explain how Tim can show that the Modified Internal Rate of Return is the more realistic measure to use in the case of mutually exclusive projects. 6. Calculate the Profitability Index for each proposal. Can this measure help to solve the dilemma? Explain. 7. In looking over the documentation prepared by the two project teams, it appears to you that the synthetic resin team has been somewhat more conservative in its revenue projections than the epoxy resin team. What impact might this have on your analysis? 8. In looking over the documentation prepared by the two project teams, it appears to you that the synthetic resin technology would require extensive development before it could be implemented whereas the epoxy resin technology is available "off-the-shelf." What impact might this have on your analysis? TABLE 1: SYNTHETIC RESIN NET CASH FLOV CUMULATIVE CASH FLOW PV CUMULATIVE PV 50000 400000 500000 650000 700000 650000 -250000 250000 900000 1600000 000000 318181.8182 330578 5 3756574 443958.7 4346449 1000000 681818.182351240 24417.73 468376.5 9030214 600000 400000 300000 200000 200000 200000 200000 500000 700000 900000 800000 545454.5455 330578 5 225394.4 136602.7 124184.3 800000 -254545.455 76033.05 301427.5 438030.2 562214 5 0 200000 450000 500000 1000000 7 NET CASH FLOW (EPOXY RESIN CUMULATIVE CASH FLOW PRESENT VALUE CUMULATIVE PRESENT VALUE CASH FLOW DIFFERENCE 800000 250000 SYNTHETIC RESIN EPOXY RESIN 1) PAYBACK PERIOD SINCE PAYBACK PERIOD DOES NOT CONSIDER HE TIME VALUE OF MONEY, AND THE CASH FLOWS FOR BOTH PROJECTS ARE DIFFERENT, PAYBACK PERIOD IS NOT APPROPRIATE IN THIS CASE 18 TIME CAN ASK THE BOAD TO USE DPP AS A PROXY MEASURE O AN ADDITIONAL MEASURE TO CONSIDER THE TIME IT WOULD TAKE FOR THE PROJECTS TO RECOVER THE INITIAL INVESTMENT IRR CAN BE MISLEADING INT HIS CASE BECAUSE THE INITIAL INVESTMENT FO THE PROJECTS (YEAR O CASH FLOWI ARE DIFFERENT FOR BOTH PROJECTS. ALSO, IRR ASSUMES THAT THE CASH FLOWS ARE REINVESTED AT IRR ITSELF WHICH IS A HIGHLY UNRELASTIC ASSUMPTION 25 WACC SYNTHETIC RES EXPOXY RES $1,600,000.00 $900,000.00 0 $1,211,288 851571463737 5903,02140 S562,214.45 55,226.73 5435,237.46 5453,575.10 5328,215.02 5170,852.05 5170,902.71 0.3$149,613.65 5158,656.07 533,762.85 590,672.16 512.29 570,432.04 30 31 0.291 0.35 0.3663 36 $64,348.1 0.4291 CROSSOVER RATE CROSSOVER RATE IS THE RATE OF RETURN AT WHICH THE NPV OF BOTH SYNTHETIC AND EXPOXY RESIN IS EQUAL THEREFORE, IN THIS CASE, IT GOES TO SHOW WHEN ONE INVESTMENT PROJECT BECOMES SUPERIOR TO ANOTHER AS A RESULT OF A CHANGE IN RATE OF RETURN. IT HELPS TO SHOW WHICH PROJECT WILL BE MORE PROFITABLE IN BOTH SHORT AND LONG TERM IM HAS TO CONVINCE THE BOARD THA THE RESULT OF SYNETHIC RESIN IS MORE FRUITFUL THAN EXPOXY BECAUSE THE NPV OF SYN IS MORE THAN EXPOXY, NPV METHOD IS MORE SUITABLE THAN IRR IN CASE OF EXCLUSIVE PROJECTS IR I5 USED WHERE DISCOUNT FACTOR I5 GIVEN AND THE IRR IS MORE THAN THE DISCOUNT RATE. IRR PLAYS THE SUPPORTIVE ROLE OF NPV METHOO, PAYBACK METHOO IS CONSIDERD WHEN THE COMPANY HAS BACK TO BACK PROJECTS TO HANDLE IN SUCH CASE, THE COMPANY CAN CONSIDER EXPOY RESIN OVER SYNTHETIC BECAUSE PER YEAR CASH BACK HIGHER


