

Question
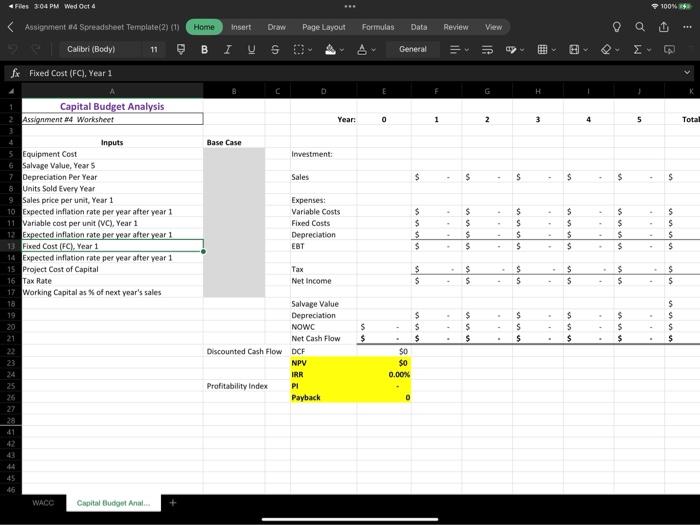
Based on the inputs below prepare a capital budget analysis for this Base Case using the Net Present Value, Internal Rate of Return, Profitability Index
Based on the inputs below prepare a capital budget analysis for this Base Case using the Net Present Value, Internal Rate of Return, Profitability Index and Payback in years methods, determining whether the project is feasible. The Weighted Average Cost of Capital also needs to be determined to complete the analysis
Spreadsheet template is provided, you need to fill in and complete the calculations.
Project Inputs:
Cost of Capital:
U.S. Treasury 10-year yield = 4.31%
S&P 500 Return = 12.5%
Capital Structure = Liabilities (55%), Equity (45%)
Firm's Cost of Debt = Prime Interest Rate plus 3%
Company's Beta = 1.40
Project Investment Outlay, Year 0 - $750,000
Project Investment Life - 5 years
Project Depreciation - $150,000 / year
Project Salvage Value - $25,000
Working Capital Base of Annual Sales - 10%
Project Tax Rate - 22%
Inflation Rate for Selling Price/unit, Variable Cost/unit, and Fixed Costs = 4.0% after Year 1
Units sold per year - 40,000
Selling Price per Unit, Year 1 - $40.00
Fixed operating costs per year excluding depreciation - $175,000
Manufacturing (Variable) costs per unit, Year 1 - $30.00
Step by Step Solution
There are 3 Steps involved in it
Step: 1

Get Instant Access to Expert-Tailored Solutions
See step-by-step solutions with expert insights and AI powered tools for academic success
Step: 2

Step: 3
Ace Your Homework with AI
Get the answers you need in no time with our AI-driven, step-by-step assistance
Get Started
Handbook Of Business Valuation
Authors: Thomas L. West, Jeffrey D. Jones
2nd Edition
0471297879, 978-0471297871