Based on the models provided. Compare your growth rate to the Professionals . How close are your estimates?
Pls help to revert to me by 2moro.
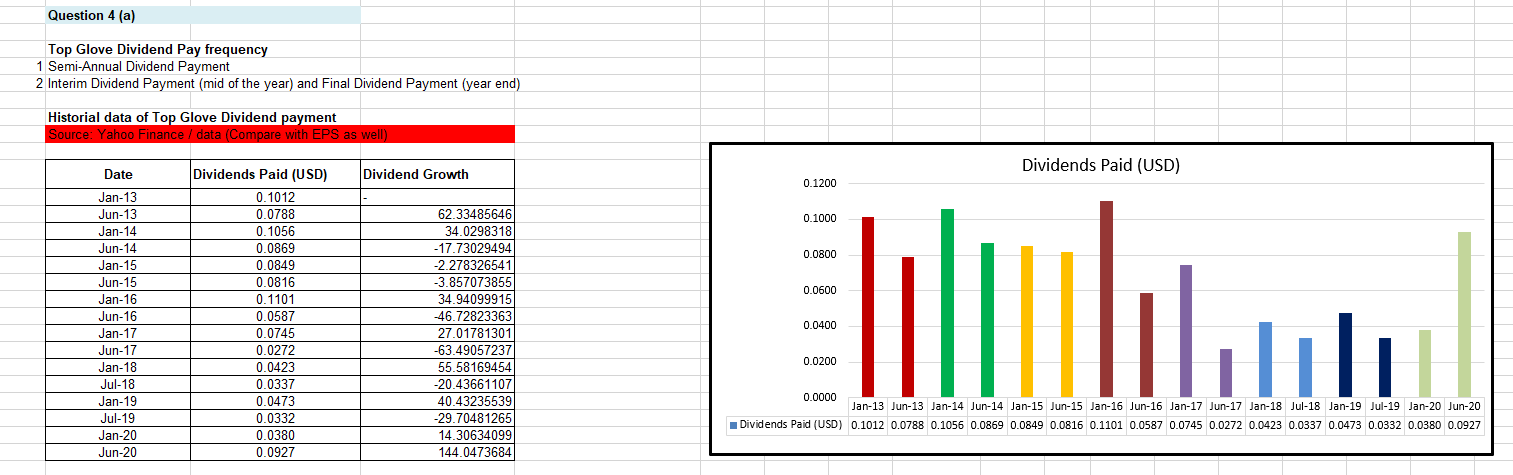
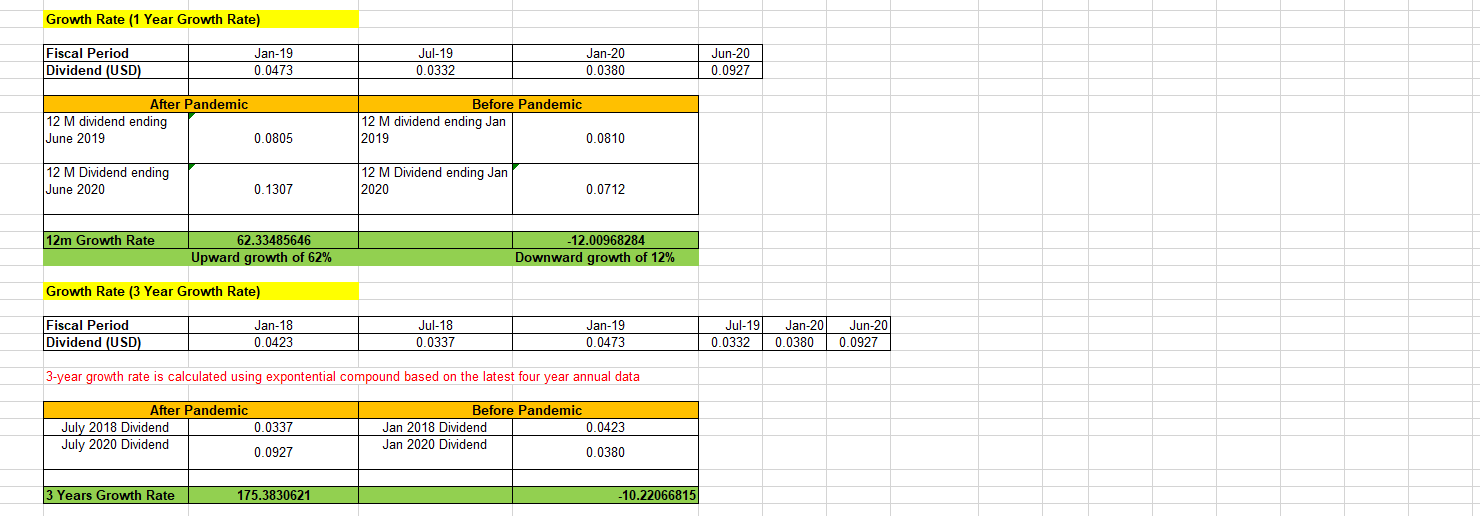
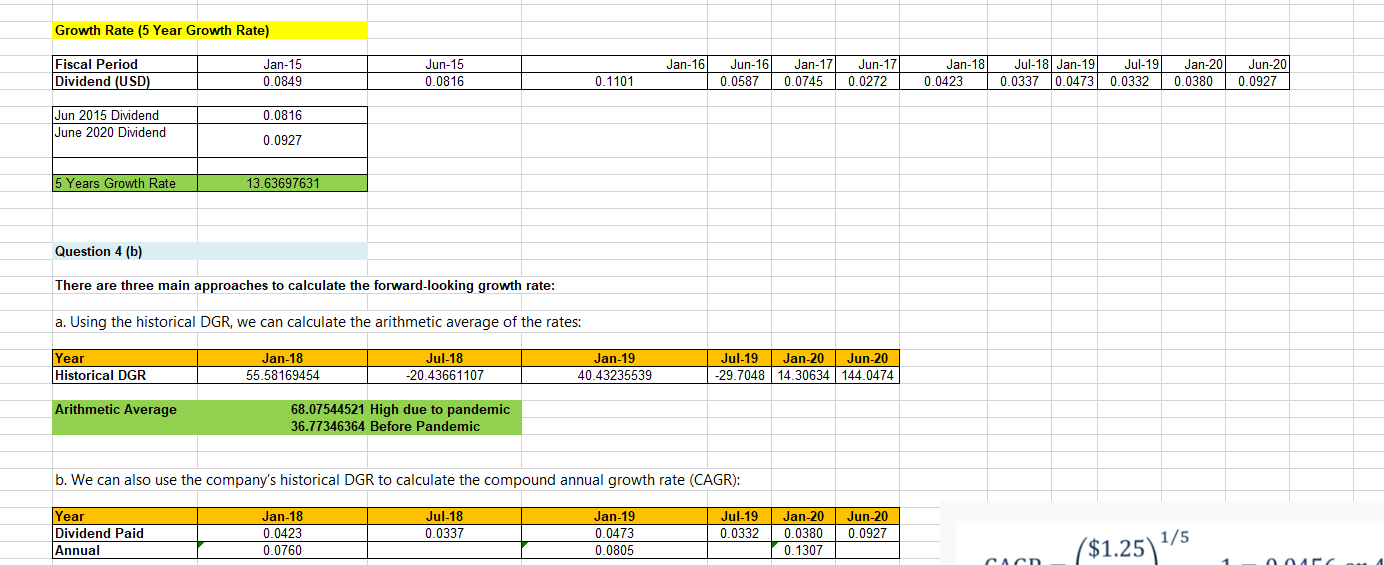
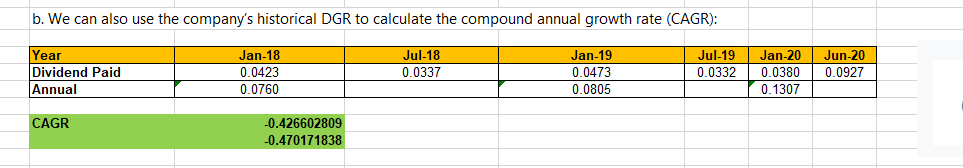
Question 4 (a) Top Glove Dividend Pay frequency 1 Semi-Annual Dividend Payment 2 Interim Dividend Payment (mid of the year) and Final Dividend Payment (year end) Historial data of Top Glove Dividend payment Source: Yahoo Finance / data (Compare with EPS as well) Dividends Paid (USD) Dividend Growth 0.1200 0.1000 0.0800 Date Jan-13 Jun-13 Jan-14 Jun-14 Jan-15 Jun-15 Jan-16 Jun-16 Jan-17 Jun-17 Jan-18 Jul-18 Jan-19 Jul-19 Jan-20 Jun-20 Dividends Paid (USD) 0.1012 0.0788 0.1056 0.0869 0.0849 0.0816 0.1101 0.0587 0.0745 0.0272 0.0423 0.0337 0.0600 62.33485646 34.0298318 -17.73029494 -2.278326541 -3.857073855 34.94099915 -46.72823363 27.01781301 -63.49057237 55.58169454 -20.43661107 40.43235539) -29.70481265 14.30634099 144.0473684 || 0.0400 0.0200 0.0473 0.0332 0.0380 0.0927 0.0000 Jan-13 Jun-13 Jan-14 Jun-14 Jan-15 Jun-15 Jan-16 Jun-16 Jan-17 Jun-17 Jan-18 Jul-18 Jan-19 Jul-19 Jan-20 Jun-20 Dividends Paid (USD) 0.1012 0.0788 0.1056 0.0869 0.0849 0.0816 0.1101 0.0587 0.0745 0.0272 0.0423 0.0337 0.0473 0.0332 0.0380 0.0927 Growth Rate (1 Year Growth Rate) Fiscal Period Dividend (USD) Jan-19 0.0473 Jul-19 0.0332 Jan-20 0.0380 Jun-20 0.0927 After Pandemic 12 M dividend ending June 2019 0.0805 Before Pandemic 12 M dividend ending Jan 2019 0.0810 12 M Dividend ending June 2020 12 M Dividend ending Jan 2020 0.1307 0.0712 12m Growth Rate 62.33485646 Upward growth of 62% -12.00968284 Downward growth of 12% Growth Rate (3 Year Growth Rate) Fiscal Period Dividend (USD) Jan-18 0.0423 Jul-18 0.0337 Jan-19 0.0473 Jul-19 0.0332 Jan-20 0.0380 Jun-201 0.0927 3-year growth rate is calculated using expontential compound based on the latest four year annual data After Pandemic July 2018 Dividend July 2020 Dividend 0.0337 Before Pandemic Jan 2018 Dividend 0.0423 Jan 2020 Dividend 0.0380 0.0927 3 Years Growth Rate 175.3830621 -10.22066815 Growth Rate (5 Year Growth Rate) Jan-16 Fiscal Period Dividend (USD) Jan-15 0.0849 Jun-15 0.0816 Jan-20 Jun-16 0.0587 Jan-17 0.0745 Jun-17 0.0272 Jul-18 Jan-191 0.0337 0.0473 0.1101 Jan-18 0.0423 Jul-19 0.0332 Jun-20 0.0927 0.0380 0.0816 Jun 2015 Dividend June 2020 Dividend 0.0927 5 Years Growth Rate 13.63697631 Question 4 (b) There are three main approaches to calculate the forward-looking growth rate: a. Using the historical DGR, we can calculate the arithmetic average of the rates: Year Historical DGR Jan-18 55.58169454 Jul-18 -20.43661107 Jan-19 40.43235539 Jul-19 Jan-20 Jun-20 -29.7048 14.30634 144.0474 Arithmetic Average 68.07544521 High due to pandemic 36.77346364 Before Pandemic b. We can also use the company's historical DGR to calculate the compound annual growth rate (CAGR): Year Dividend Paid Annual Jan-18 0.0423 0.0760 Jul-18 0.0337 Jan-19 0.0473 0.0805 Jul-19 0.0332 Jan-20 0.0380 0.1307 Jun-20 0.0927 1/5 ($1.25) Can Arc b. We can also use the company's historical DGR to calculate the compound annual growth rate (CAGR): Year Dividend Paid Annual Jan-18 0.0423 0.0760 Jul-18 0.0337 Jan-19 0.0473 0.0805 Jul-19 0.0332 Jan-20 0.0380 0.1307 Jun-20 0.0927 CAGR -0.426602809 -0.470171838 Question 4 (a) Top Glove Dividend Pay frequency 1 Semi-Annual Dividend Payment 2 Interim Dividend Payment (mid of the year) and Final Dividend Payment (year end) Historial data of Top Glove Dividend payment Source: Yahoo Finance / data (Compare with EPS as well) Dividends Paid (USD) Dividend Growth 0.1200 0.1000 0.0800 Date Jan-13 Jun-13 Jan-14 Jun-14 Jan-15 Jun-15 Jan-16 Jun-16 Jan-17 Jun-17 Jan-18 Jul-18 Jan-19 Jul-19 Jan-20 Jun-20 Dividends Paid (USD) 0.1012 0.0788 0.1056 0.0869 0.0849 0.0816 0.1101 0.0587 0.0745 0.0272 0.0423 0.0337 0.0600 62.33485646 34.0298318 -17.73029494 -2.278326541 -3.857073855 34.94099915 -46.72823363 27.01781301 -63.49057237 55.58169454 -20.43661107 40.43235539) -29.70481265 14.30634099 144.0473684 || 0.0400 0.0200 0.0473 0.0332 0.0380 0.0927 0.0000 Jan-13 Jun-13 Jan-14 Jun-14 Jan-15 Jun-15 Jan-16 Jun-16 Jan-17 Jun-17 Jan-18 Jul-18 Jan-19 Jul-19 Jan-20 Jun-20 Dividends Paid (USD) 0.1012 0.0788 0.1056 0.0869 0.0849 0.0816 0.1101 0.0587 0.0745 0.0272 0.0423 0.0337 0.0473 0.0332 0.0380 0.0927 Growth Rate (1 Year Growth Rate) Fiscal Period Dividend (USD) Jan-19 0.0473 Jul-19 0.0332 Jan-20 0.0380 Jun-20 0.0927 After Pandemic 12 M dividend ending June 2019 0.0805 Before Pandemic 12 M dividend ending Jan 2019 0.0810 12 M Dividend ending June 2020 12 M Dividend ending Jan 2020 0.1307 0.0712 12m Growth Rate 62.33485646 Upward growth of 62% -12.00968284 Downward growth of 12% Growth Rate (3 Year Growth Rate) Fiscal Period Dividend (USD) Jan-18 0.0423 Jul-18 0.0337 Jan-19 0.0473 Jul-19 0.0332 Jan-20 0.0380 Jun-201 0.0927 3-year growth rate is calculated using expontential compound based on the latest four year annual data After Pandemic July 2018 Dividend July 2020 Dividend 0.0337 Before Pandemic Jan 2018 Dividend 0.0423 Jan 2020 Dividend 0.0380 0.0927 3 Years Growth Rate 175.3830621 -10.22066815 Growth Rate (5 Year Growth Rate) Jan-16 Fiscal Period Dividend (USD) Jan-15 0.0849 Jun-15 0.0816 Jan-20 Jun-16 0.0587 Jan-17 0.0745 Jun-17 0.0272 Jul-18 Jan-191 0.0337 0.0473 0.1101 Jan-18 0.0423 Jul-19 0.0332 Jun-20 0.0927 0.0380 0.0816 Jun 2015 Dividend June 2020 Dividend 0.0927 5 Years Growth Rate 13.63697631 Question 4 (b) There are three main approaches to calculate the forward-looking growth rate: a. Using the historical DGR, we can calculate the arithmetic average of the rates: Year Historical DGR Jan-18 55.58169454 Jul-18 -20.43661107 Jan-19 40.43235539 Jul-19 Jan-20 Jun-20 -29.7048 14.30634 144.0474 Arithmetic Average 68.07544521 High due to pandemic 36.77346364 Before Pandemic b. We can also use the company's historical DGR to calculate the compound annual growth rate (CAGR): Year Dividend Paid Annual Jan-18 0.0423 0.0760 Jul-18 0.0337 Jan-19 0.0473 0.0805 Jul-19 0.0332 Jan-20 0.0380 0.1307 Jun-20 0.0927 1/5 ($1.25) Can Arc b. We can also use the company's historical DGR to calculate the compound annual growth rate (CAGR): Year Dividend Paid Annual Jan-18 0.0423 0.0760 Jul-18 0.0337 Jan-19 0.0473 0.0805 Jul-19 0.0332 Jan-20 0.0380 0.1307 Jun-20 0.0927 CAGR -0.426602809 -0.470171838