

Answered step by step
Verified Expert Solution
Question
1 Approved Answer
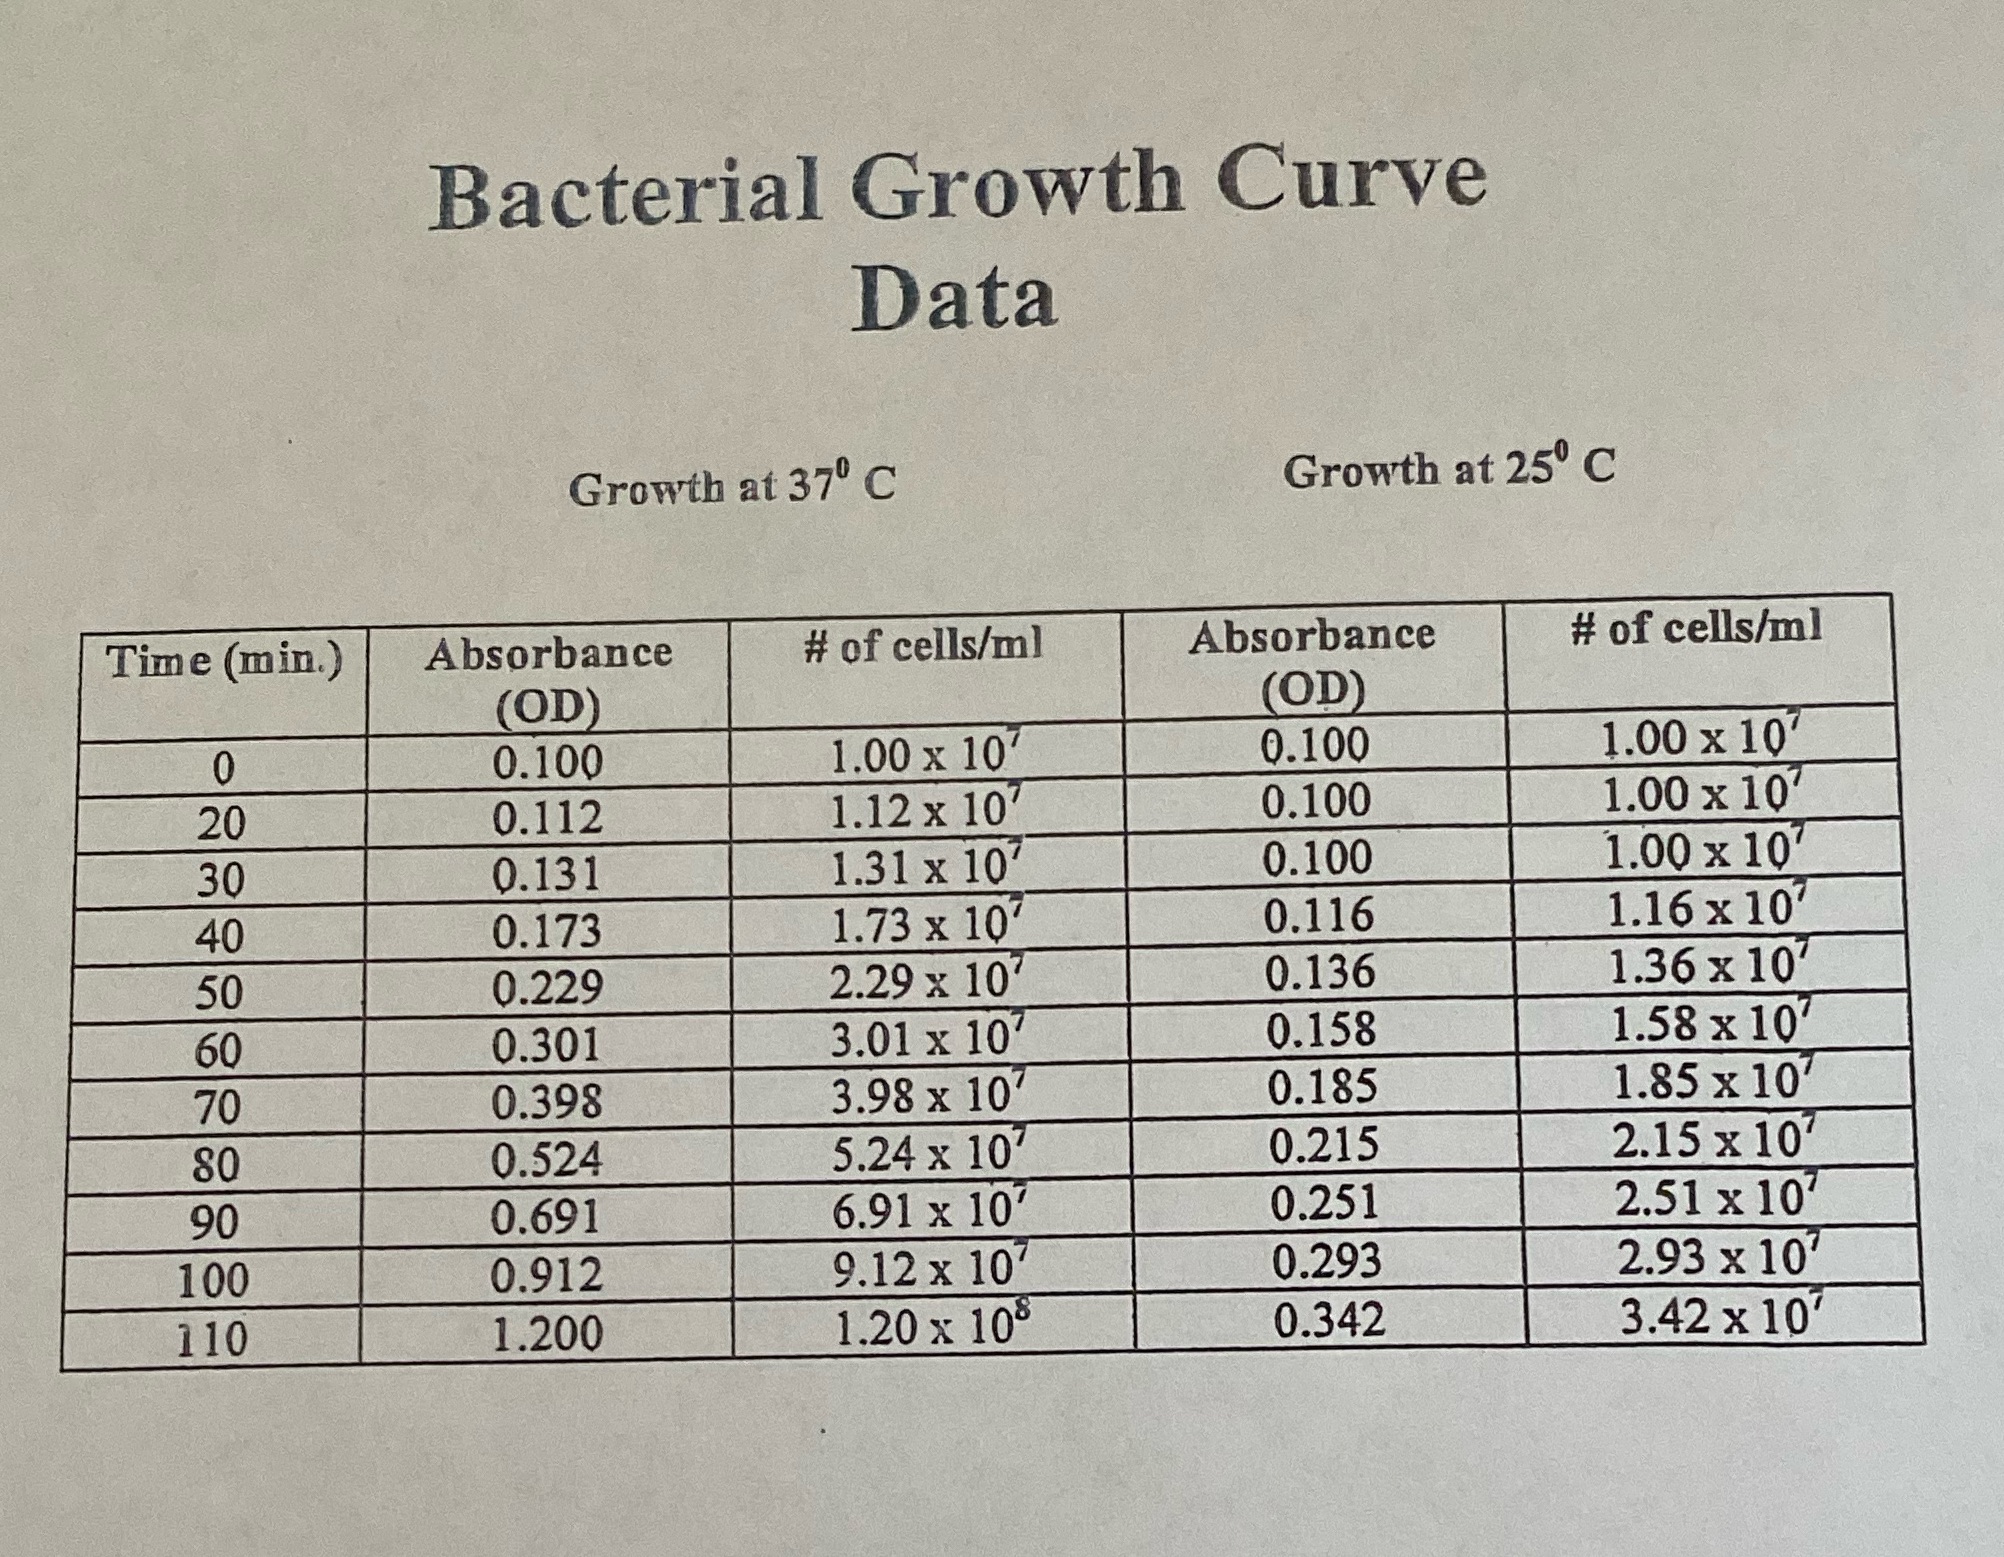
Based on the results please help me graph the following table. Bacterial Growth Curve Data Growth at 37' C Growth at 250 C Time (min.)
Based on the results please help me graph the following table.
Step by Step Solution
There are 3 Steps involved in it
Step: 1

Get Instant Access to Expert-Tailored Solutions
See step-by-step solutions with expert insights and AI powered tools for academic success
Step: 2

Step: 3
Ace Your Homework with AI
Get the answers you need in no time with our AI-driven, step-by-step assistance
Get Started
College Algebra With Applications
Authors: Ernest Julius Wilczynski ,Herbert Ellsworth Slaught
1st Edition
1017336490, 978-1017336498