Answered step by step
Verified Expert Solution
Question
1 Approved Answer
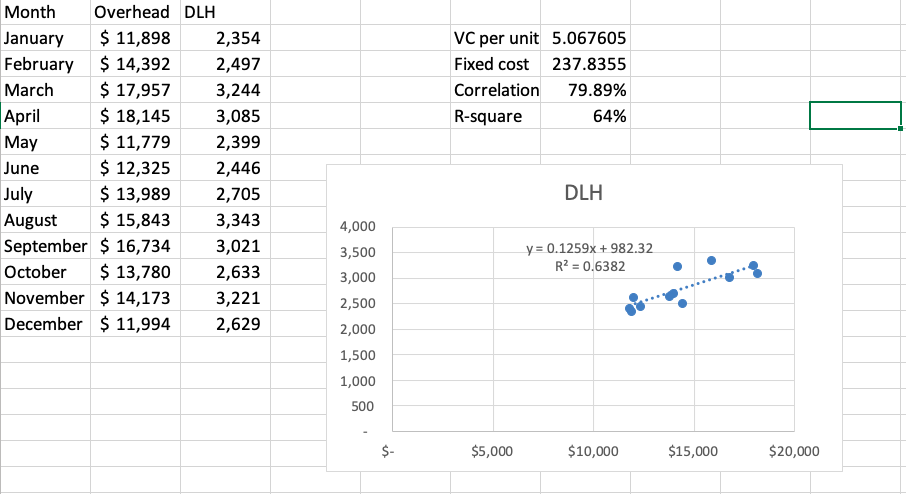
Based on the R-square value in the regression analysis, for which mixed cost is DL the best predictors? For which is it worst predictor? Explain?

Based on the R-square value in the regression analysis, for which mixed cost is DL the best predictors? For which is it worst predictor? Explain?
Month Overhead DLH $ 11,898 |January 2,354 VC per unit 5.067605 14,392 $ 17,957 $18,145 $ 11,779 $12,325 $ 13,989 February Fixed cost 237.8355 2,497 March Correlation 79.89% 3,244 |April 3,085 64% R-square May 2,399 June 2,446 DLH July 2,705 $15,843 August 3,343 4,000 September 16,734 3,021 y 0.1259x+982.32 R2 = 0.6382 3,500 $ 13,780 October 2,633 3,000 November $14,173 3,221 2,500 December $11,994 2,629 2,000 1,500 1,000 500 $5,000 $10,000 $15,000 $20,000 Month Overhead DLH $ 11,898 |January 2,354 VC per unit 5.067605 14,392 $ 17,957 $18,145 $ 11,779 $12,325 $ 13,989 February Fixed cost 237.8355 2,497 March Correlation 79.89% 3,244 |April 3,085 64% R-square May 2,399 June 2,446 DLH July 2,705 $15,843 August 3,343 4,000 September 16,734 3,021 y 0.1259x+982.32 R2 = 0.6382 3,500 $ 13,780 October 2,633 3,000 November $14,173 3,221 2,500 December $11,994 2,629 2,000 1,500 1,000 500 $5,000 $10,000 $15,000 $20,000
Step by Step Solution
There are 3 Steps involved in it
Step: 1

Get Instant Access to Expert-Tailored Solutions
See step-by-step solutions with expert insights and AI powered tools for academic success
Step: 2

Step: 3

Ace Your Homework with AI
Get the answers you need in no time with our AI-driven, step-by-step assistance
Get Started


