Based on the two-stage DDM methodology, what are the stock recommendations for APPL and MSFT? 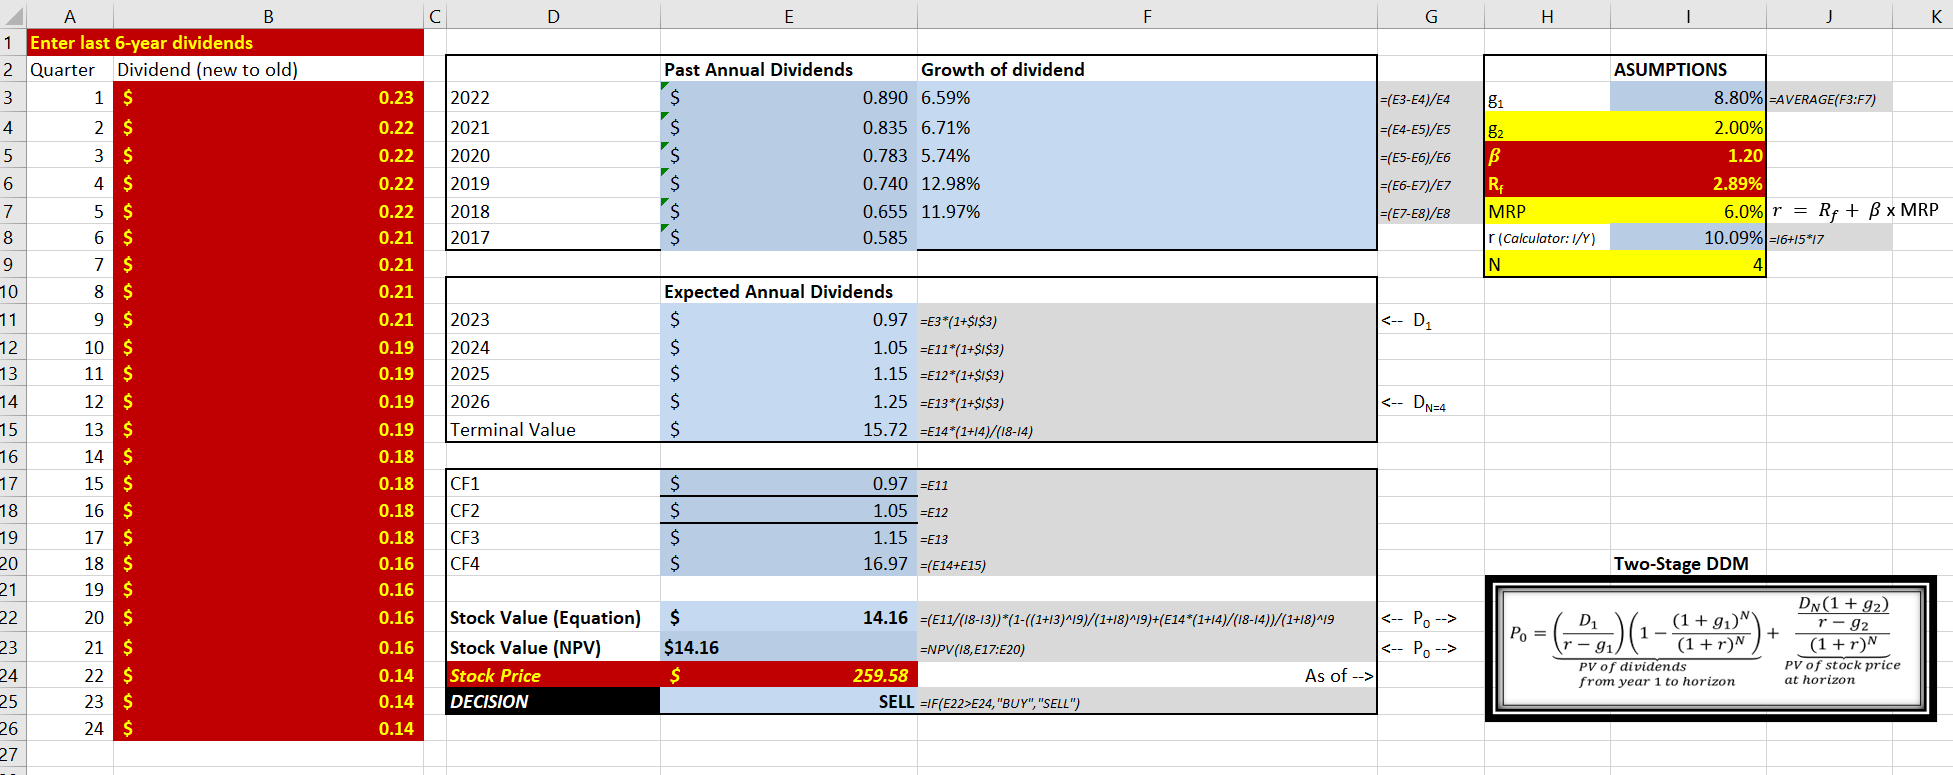
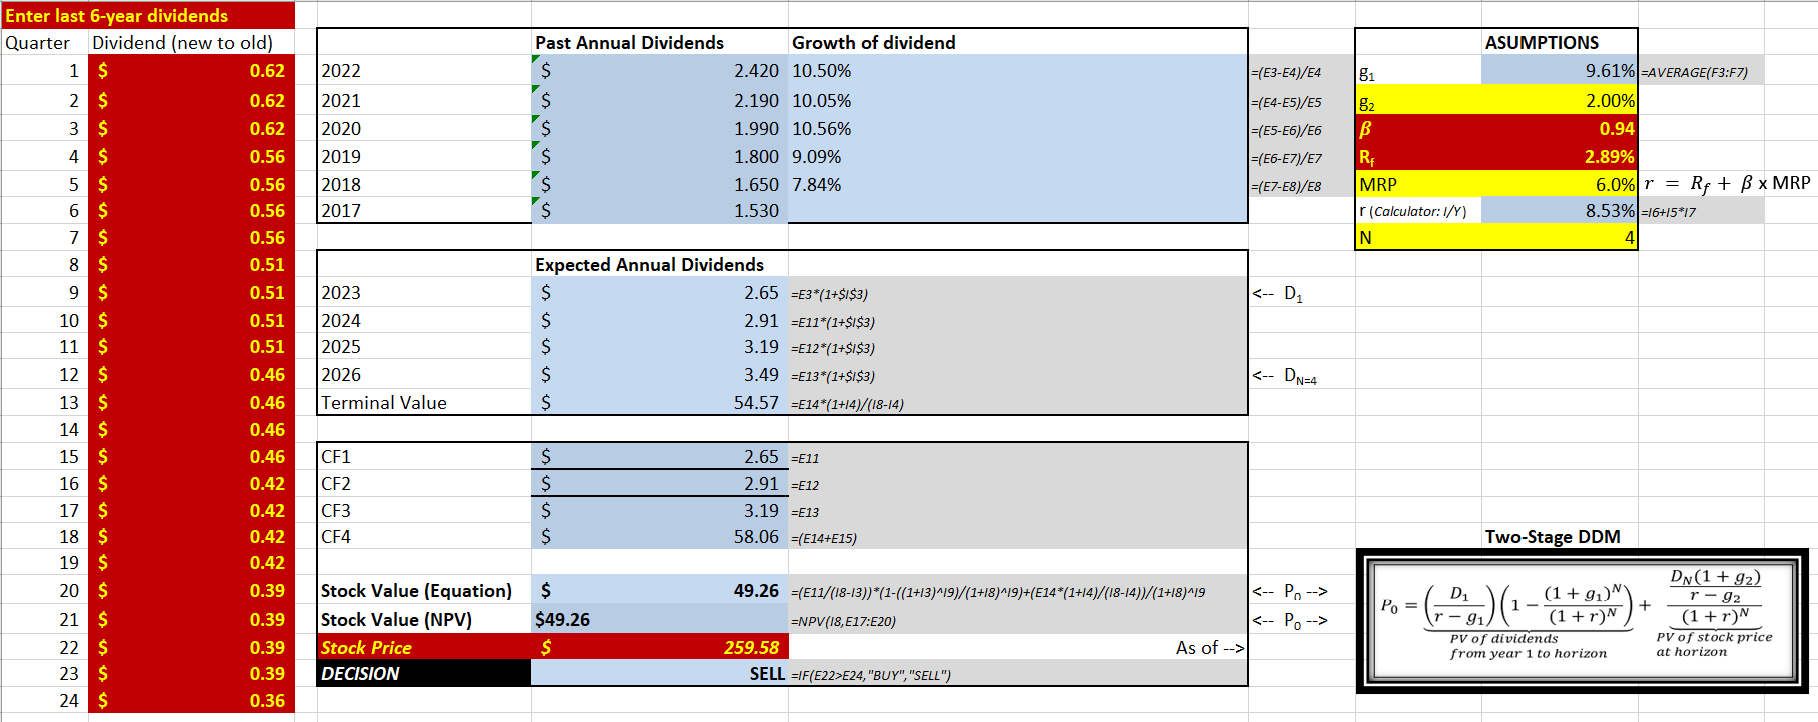
1 Enter last 6-year dividends 2 Quarter Dividend (new to old) 3 4 5 6 7 8 9 10 11 12 13 14 15 6189 85 23 N 17 20 21 22 24 25 26 27 B 1 $ 2 $ 3 $ 4 $ 5 $ 6 $ 7 $ 8 $ 9 $ 10 $ 11 $ 12 $ 13 $ 14 $ 15 $ 16 $ 17 $ 18 $ 19 $ 20 $ 21 $ 22 $ 23 $ 24 $ U D 0.23 2022 0.22 2021 0.22 2020 0.22 2019 0.22 2018 0.21 2017 0.21 0.21 0.21 0.19 0.19 0.19 0.19 0.18 0.18 CF1 0.18 CF2 0.18 CF3 0.16 CF4 0.16 0.16 Stock Value (Equation) Stock Value (NPV) Stock Price 2023 2024 2025 2026 Terminal Value 0.16 0.14 0.14 DECISION 0.14 Past Annual Dividends S $ E $ $ $ $ $ $14.16 $ Expected Annual Dividends $ $ $ $ $ 0.890 6.59% Growth of dividend 0.835 6.71% 0.783 5.74% 0.740 12.98% 0.655 11.97% 0.585 0.97 E3*(1+$1$3) 1.05 =E11*(1+$1$3) 1.15 =E12*(1+$1$3) 1.25 =E13*(1+$1$3) 15.72 =E14*(1+14)/(18-14) 0.97 =E11 1.05 =E12 1.15 =E13 16.97 (E14+E15) 259.58 14.16 (E11/(18-13))*(1-((1+13)^19)/(1+18)^19)+(E14*(1+14)/(18-14))/(1+18)^19 =NPV (18,E17:E20) F SELL IF(E22>E24,"BUY", "SELL") As of --> =(E3-E4)/E4 81 =(E4-E5)/E5 82 |=(E5-E6)/E6 B |=(E6-E7)/E7 R |=(E7-E8)/E8 MRP H r (Calculator: I/Y) N ASUMPTIONS Two-Stage DDM 8.80% AVERAGE(F3:F7) 2.00% 1.20 2.89% 6.0% r = Rf + B x MRP 10.09% 16+15*17 D Po - (03) (1 - (1+7) ~) + = J PV of dividends from year 1 to horizon DN (1 +9) r92 (1 + r)N K PV of stock price at horizon Enter last 6-year dividends Quarter Dividend (new to old) 0.62 1 $ 2 $ 3 $ 4 $ 5 $ 6 $ 7 $ 8 $ 9 $ 10 $ 11 $ 12 $ 13 $ 14 $ 15 $ 16 $ 17 $ 18 $ 19 $ 20 $ 21 $ 22 $ 23 $ 24 $ 2022 2021 2020 2019 2018 2017 0.62 0.62 0.56 0.56 0.56 0.56 0.51 0.51 2023 0.51 2024 0.51 2025 0.46 2026 0.46 Terminal Value 0.46 0.46 CF1 0.42 CF2 0.42 CF3 0.42 CF4 0.42 0.39 Stock Value (Equation) Stock Value (NPV) Stock Price 0.39 0.39 0.39 DECISION 0.36 Past Annual Dividends $ $ $ $ $ $ $ $ $ Expected Annual Dividends $ $ $ $ $ $ $49.26 $ 2.420 10.50% Growth of dividend 2.190 10.05% 1.990 10.56% 1.800 9.09% 1.650 7.84% 1.530 2.65 =E3*(1+$1$3) 2.91 E11*(1+$1$3) 3.19 E12*(1+$1$3) 3.49 E13*(1+$1$3) 54.57 E14*(1+14)/(18-14) 2.65 =E11 2.91 =E12 3.19 =E13 58.06 (E14+E15) 49.26 =(E11/(18-13))*(1-((1+13)^19)/(1+18)^19)+(E14*(1+14)/(18-14))/(1+18)^19 259.58 =NPV(18,E17:E20) SELL IF(E22>E24,"BUY","SELL") As of --> =(E3-E4)/E4 81 =(E4-E5)/E5 82 =(E5-E6)/E6 Rf MRP =(E6-E7)/E7 =(E7-E8)/E8 r (Calculator: I/Y) N ASUMPTIONS 9.61% -AVERAGE(F3:F7) 2.00% 0.94 2.89% 6.0% r=Rf + x MRP B 8.53% 16+15*17 41 Two-Stage DDM Po = (-D ) (-(+9) (1 NY N PV of dividends from year 1 to horizon + DN (1 +9) r - 92 (1+r)N PV of stock price at horizon 1 Enter last 6-year dividends 2 Quarter Dividend (new to old) 3 4 5 6 7 8 9 10 11 12 13 14 15 6189 85 23 N 17 20 21 22 24 25 26 27 B 1 $ 2 $ 3 $ 4 $ 5 $ 6 $ 7 $ 8 $ 9 $ 10 $ 11 $ 12 $ 13 $ 14 $ 15 $ 16 $ 17 $ 18 $ 19 $ 20 $ 21 $ 22 $ 23 $ 24 $ U D 0.23 2022 0.22 2021 0.22 2020 0.22 2019 0.22 2018 0.21 2017 0.21 0.21 0.21 0.19 0.19 0.19 0.19 0.18 0.18 CF1 0.18 CF2 0.18 CF3 0.16 CF4 0.16 0.16 Stock Value (Equation) Stock Value (NPV) Stock Price 2023 2024 2025 2026 Terminal Value 0.16 0.14 0.14 DECISION 0.14 Past Annual Dividends S $ E $ $ $ $ $ $14.16 $ Expected Annual Dividends $ $ $ $ $ 0.890 6.59% Growth of dividend 0.835 6.71% 0.783 5.74% 0.740 12.98% 0.655 11.97% 0.585 0.97 E3*(1+$1$3) 1.05 =E11*(1+$1$3) 1.15 =E12*(1+$1$3) 1.25 =E13*(1+$1$3) 15.72 =E14*(1+14)/(18-14) 0.97 =E11 1.05 =E12 1.15 =E13 16.97 (E14+E15) 259.58 14.16 (E11/(18-13))*(1-((1+13)^19)/(1+18)^19)+(E14*(1+14)/(18-14))/(1+18)^19 =NPV (18,E17:E20) F SELL IF(E22>E24,"BUY", "SELL") As of --> =(E3-E4)/E4 81 =(E4-E5)/E5 82 |=(E5-E6)/E6 B |=(E6-E7)/E7 R |=(E7-E8)/E8 MRP H r (Calculator: I/Y) N ASUMPTIONS Two-Stage DDM 8.80% AVERAGE(F3:F7) 2.00% 1.20 2.89% 6.0% r = Rf + B x MRP 10.09% 16+15*17 D Po - (03) (1 - (1+7) ~) + = J PV of dividends from year 1 to horizon DN (1 +9) r92 (1 + r)N K PV of stock price at horizon Enter last 6-year dividends Quarter Dividend (new to old) 0.62 1 $ 2 $ 3 $ 4 $ 5 $ 6 $ 7 $ 8 $ 9 $ 10 $ 11 $ 12 $ 13 $ 14 $ 15 $ 16 $ 17 $ 18 $ 19 $ 20 $ 21 $ 22 $ 23 $ 24 $ 2022 2021 2020 2019 2018 2017 0.62 0.62 0.56 0.56 0.56 0.56 0.51 0.51 2023 0.51 2024 0.51 2025 0.46 2026 0.46 Terminal Value 0.46 0.46 CF1 0.42 CF2 0.42 CF3 0.42 CF4 0.42 0.39 Stock Value (Equation) Stock Value (NPV) Stock Price 0.39 0.39 0.39 DECISION 0.36 Past Annual Dividends $ $ $ $ $ $ $ $ $ Expected Annual Dividends $ $ $ $ $ $ $49.26 $ 2.420 10.50% Growth of dividend 2.190 10.05% 1.990 10.56% 1.800 9.09% 1.650 7.84% 1.530 2.65 =E3*(1+$1$3) 2.91 E11*(1+$1$3) 3.19 E12*(1+$1$3) 3.49 E13*(1+$1$3) 54.57 E14*(1+14)/(18-14) 2.65 =E11 2.91 =E12 3.19 =E13 58.06 (E14+E15) 49.26 =(E11/(18-13))*(1-((1+13)^19)/(1+18)^19)+(E14*(1+14)/(18-14))/(1+18)^19 259.58 =NPV(18,E17:E20) SELL IF(E22>E24,"BUY","SELL") As of --> =(E3-E4)/E4 81 =(E4-E5)/E5 82 =(E5-E6)/E6 Rf MRP =(E6-E7)/E7 =(E7-E8)/E8 r (Calculator: I/Y) N ASUMPTIONS 9.61% -AVERAGE(F3:F7) 2.00% 0.94 2.89% 6.0% r=Rf + x MRP B 8.53% 16+15*17 41 Two-Stage DDM Po = (-D ) (-(+9) (1 NY N PV of dividends from year 1 to horizon + DN (1 +9) r - 92 (1+r)N PV of stock price at horizon