Based on this question, I need to answer
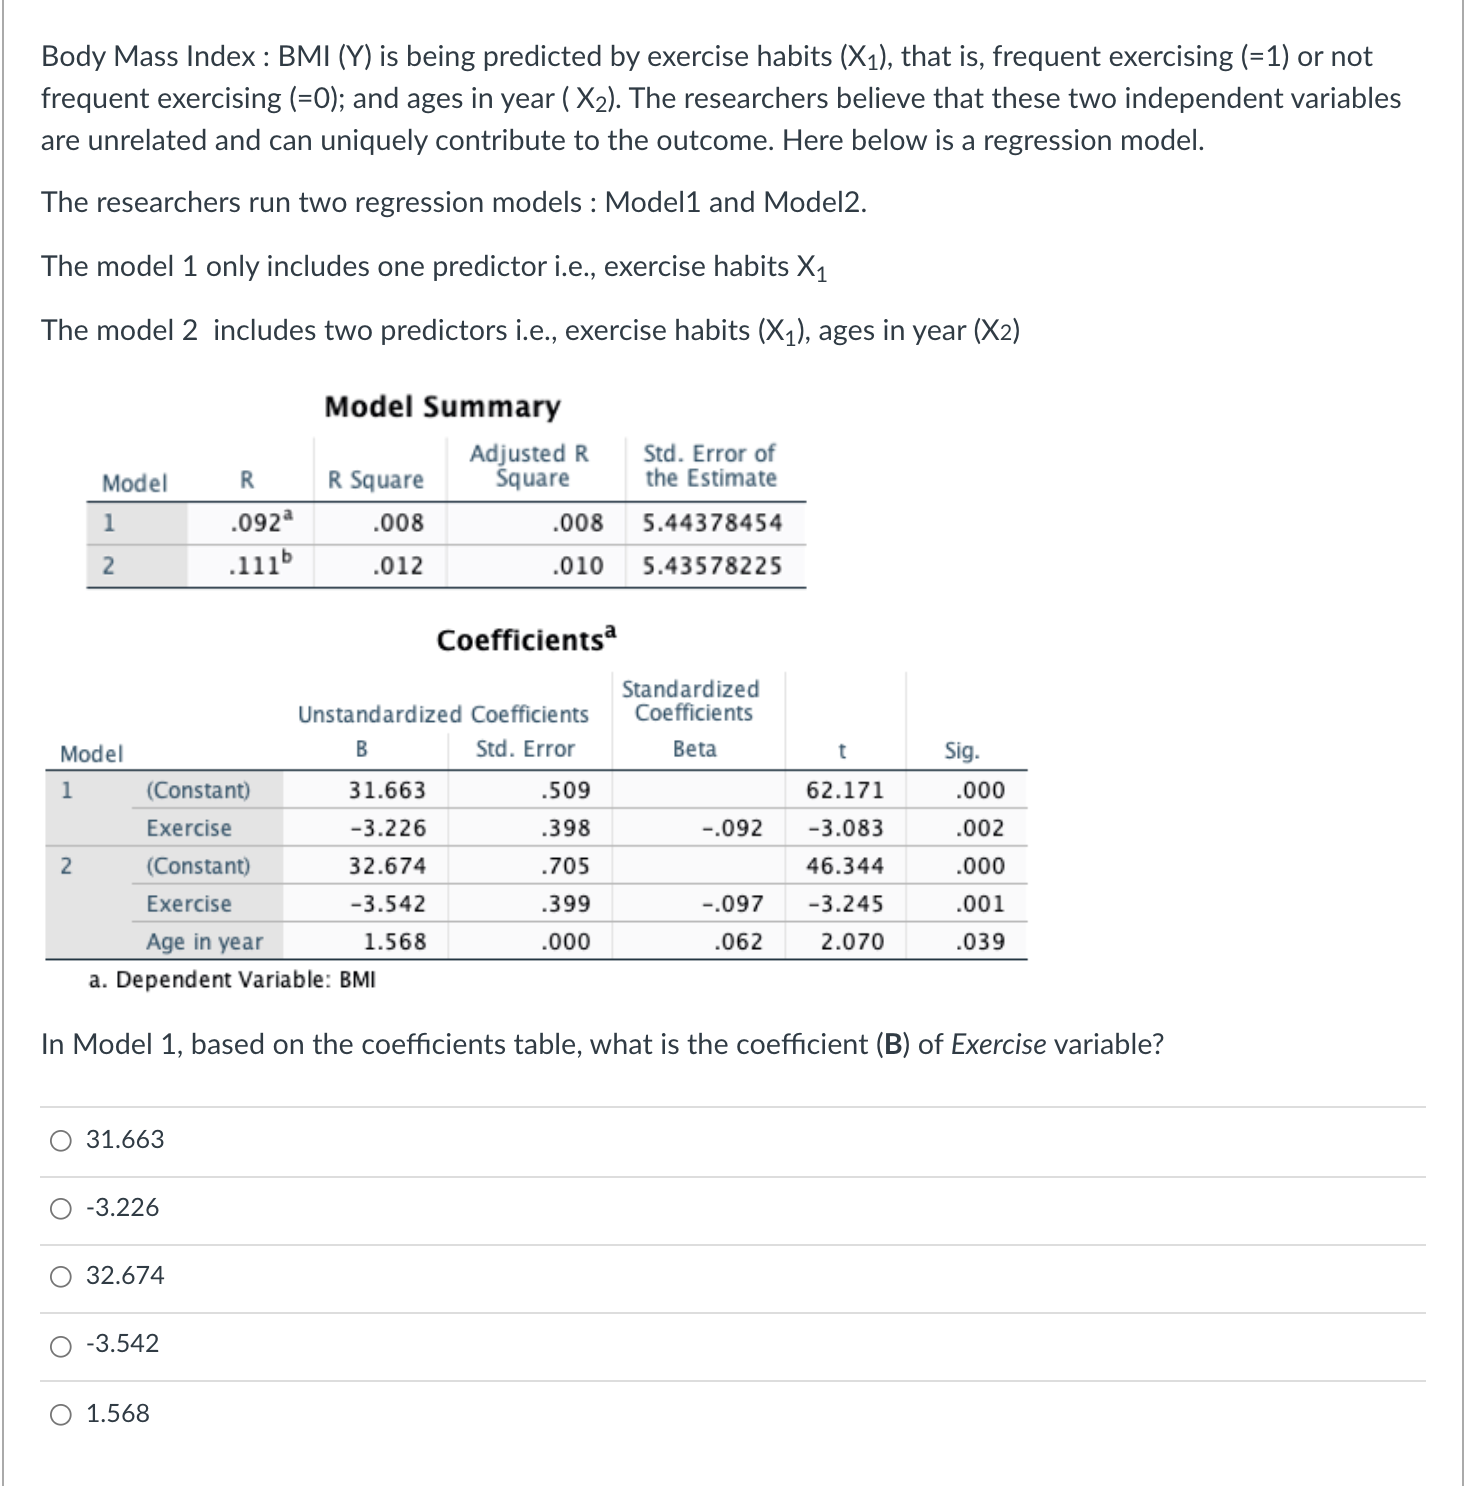
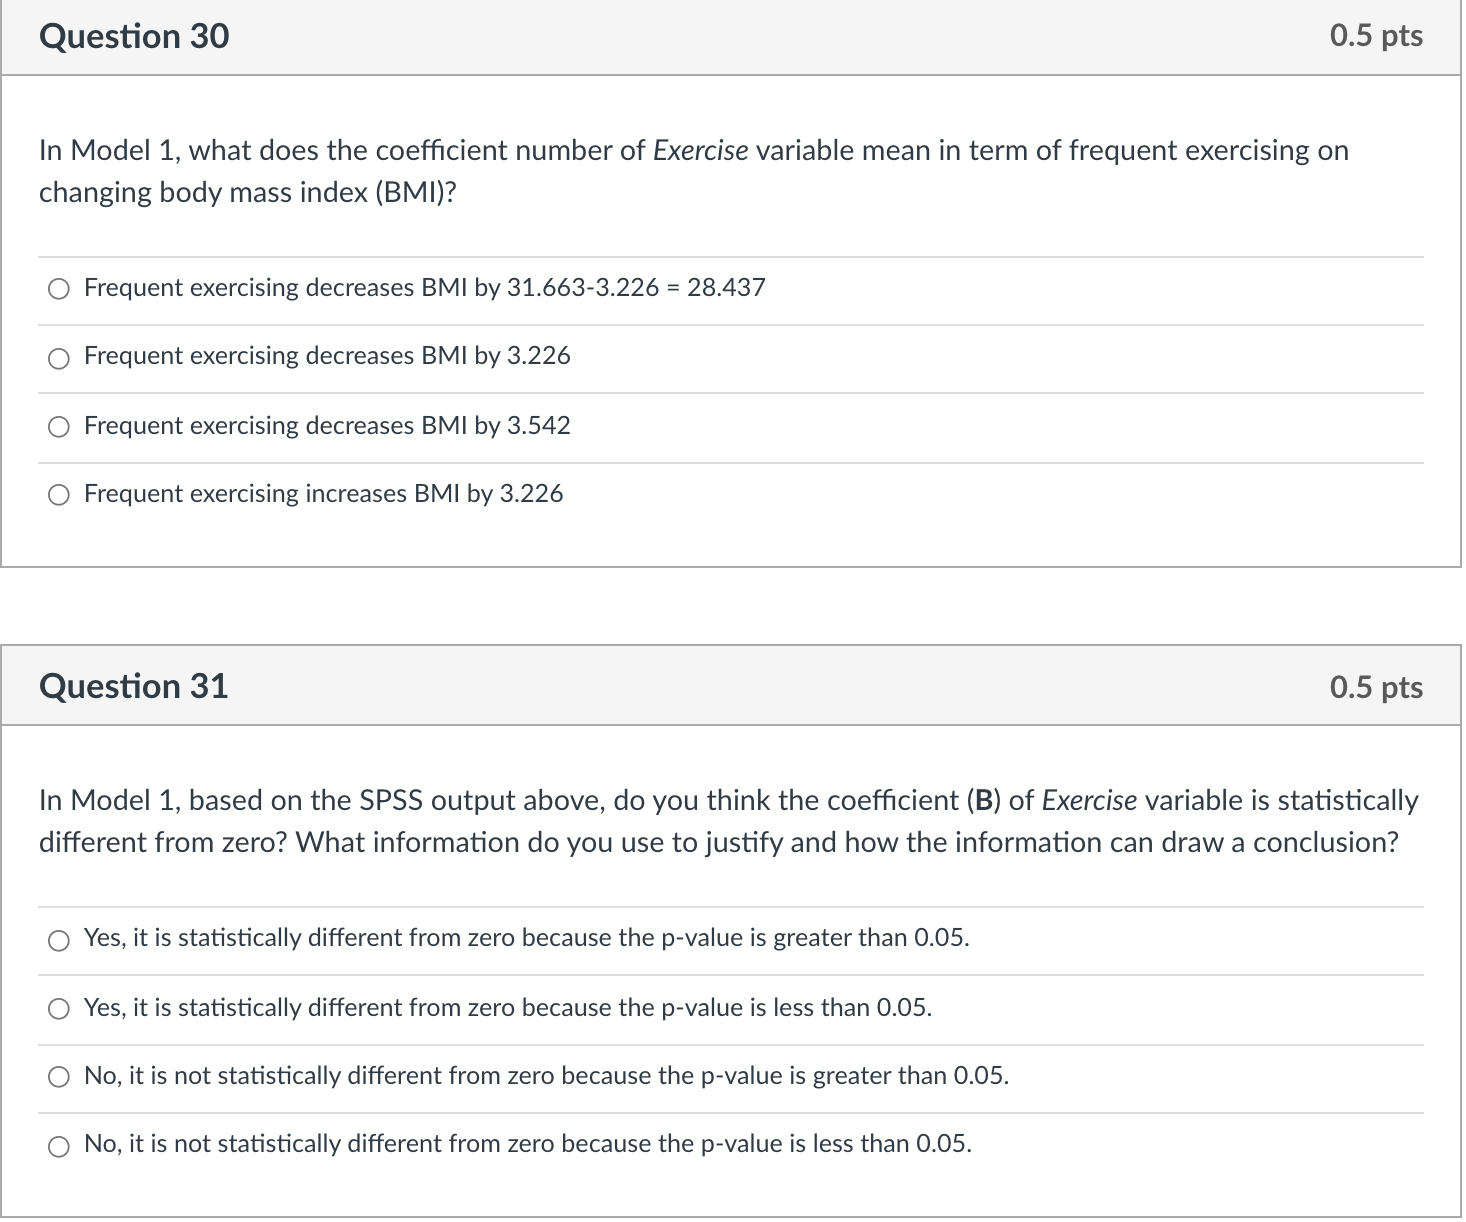
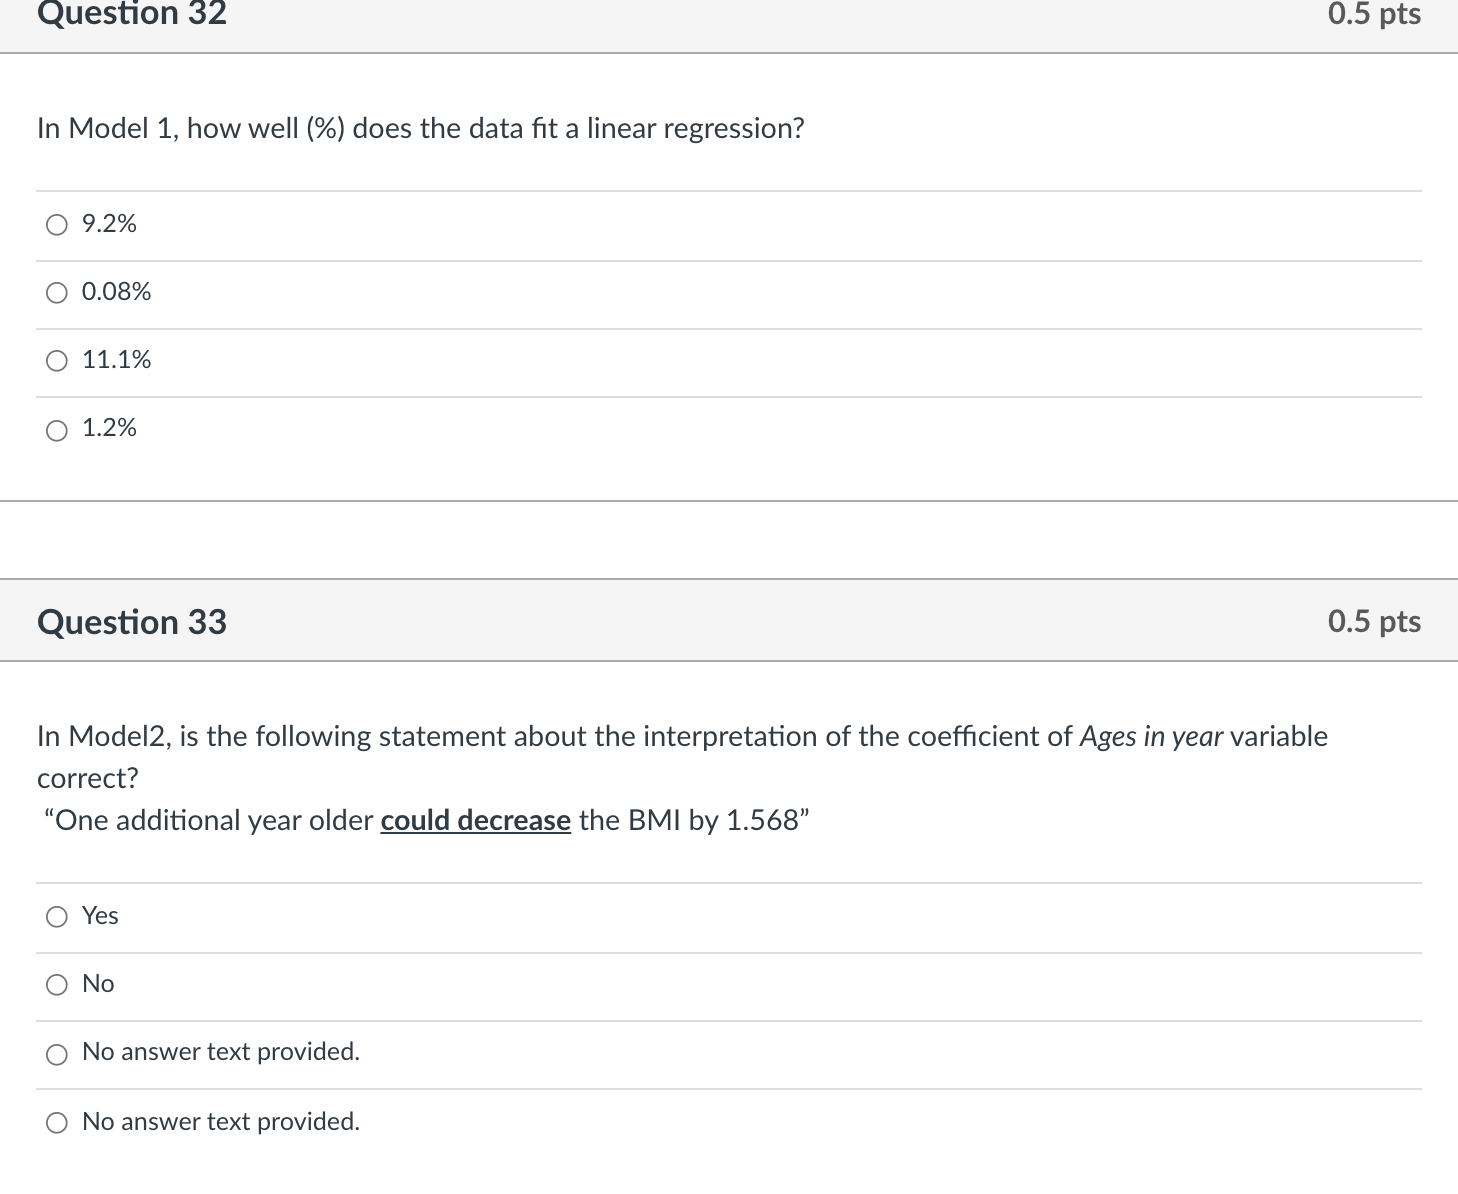
Body Mass Index : BMI (Y) is being predicted by exercise habits (X1), that is, frequent exercising (=1) or not frequent exercising (=0); and ages in year ( X2). The researchers believe that these two independent variables are unrelated and can uniquely contribute to the outcome. Here below is a regression model. The researchers run two regression models : Model1 and Model2. The model 1 only includes one predictor i.e., exercise habits X1 The model 2 includes two predictors i.e., exercise habits (X1), ages in year (X2) Model Summary Adjusted R Std. Error of Model R R Square Square the Estimate 092 008 .008 5.44378454 2 111 012 010 5.43578225 Coefficients Standardized Unstandardized Coefficients Coefficients Model B Std. Error Beta Sig. 1 (Constant) 31.663 .509 62.171 .000 Exercise -3.226 .398 -.092 -3.083 002 2 (Constant) 32.674 705 46.344 000 Exercise -3.542 399 -.097 -3.245 001 Age in year 1.568 .000 062 2.070 .039 a. Dependent Variable: BMI In Model 1, based on the coefficients table, what is the coefficient (B) of Exercise variable? O 31.663 O -3.226 32.674 O -3.542 1.568Question 30 0.5 pts In Model 1, what does the coefcient number of Exercise variable mean in term of frequent exercising on changing body mass index (BMI)? O Frequent exercising decreases BMI by 31663-3226 = 28.437 0 Frequent exercising decreases BMI by 3.226 O Frequent exercising decreases BMI by 3.542 O Frequent exercising increases BMI by 3.226 Question 31 0.5 pts In Model 1, based on the SPSS output above, do you think the coefcient (B) of Exercise variable is statistically different from zero? What information do you use to justify and how the information can draw a conclusion? 0 Yes, it is statistically different from zero because the p-value is greater than 0.05. 0 Yes, it is statistically different from zero because the p-value is less than 0.05. O No, it is not statistically different from zero because the p-value is greater than 0.05. O No, it is not statistically different from zero because the p-value is less than 0.05. Question 32 0.5 pts In Model 1, how well (%) does the data fit a linear regression? O 9.2% O 0.08% O 11.1% O 1.2% Question 33 0.5 pts In Model2, is the following statement about the interpretation of the coefficient of Ages in year variable correct? "One additional year older could decrease the BMI by 1.568" O Yes O No O No answer text provided. O No answer text provided


