Answered step by step
Verified Expert Solution
Link Copied!

Question

1 Approved Answer

Based on this SPSS including a test value (population mean) of 8, calculate the 95% confidence interval. Please show your work X *Output1 [Document1] -

Based on this SPSS including a test value (population mean) of 8, calculate the 95% confidence interval. Please show your work
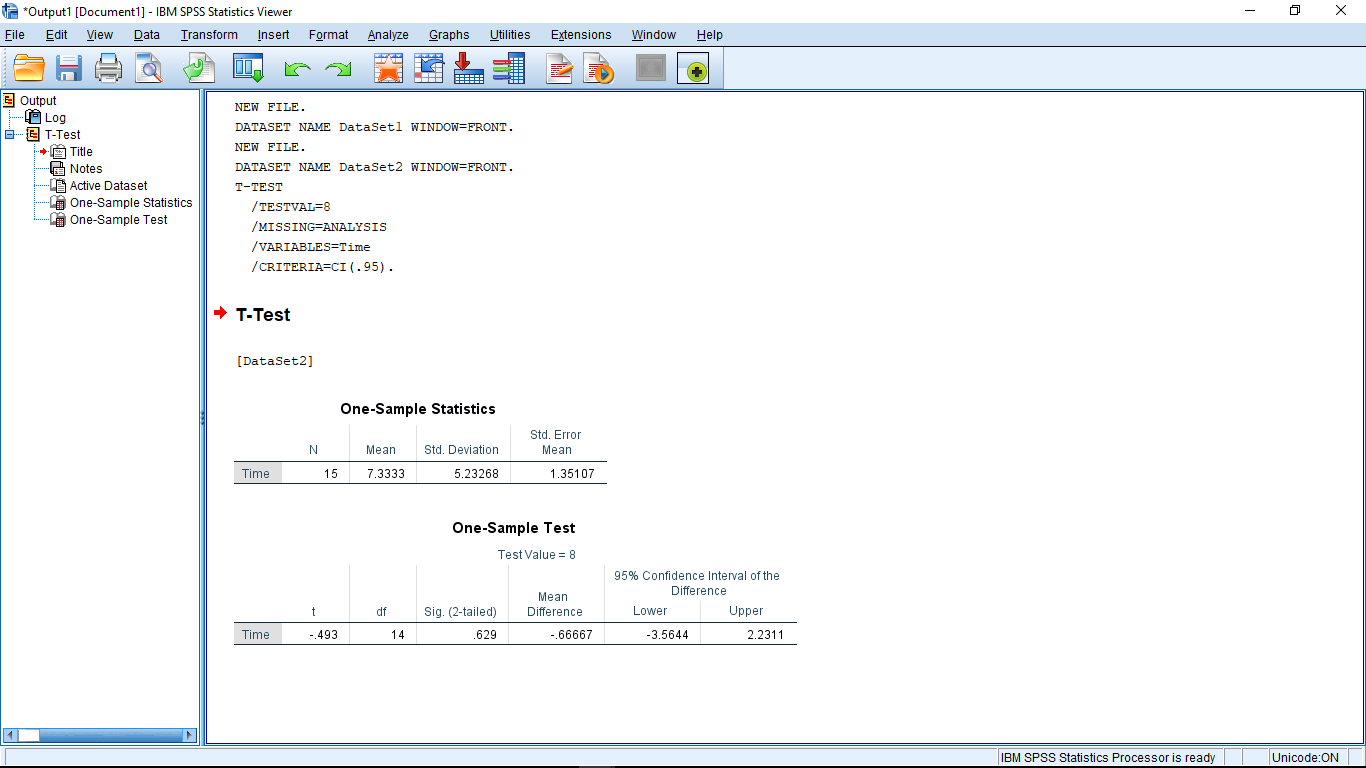
image text in transcribed
X *Output1 [Document1] - IBM SPSS Statistics Viewer File Edit View Data Transform Insert Format Analyze Graphs Utilities Extensions Window Help GHAD E Output NEW FILE. ... Log DATASET NAME DataSetl WINDOW=FRONT. BE T-Test + Title NEW FILE Notes DATASET NAME DataSet2 WINDOW=FRONT. Active Dataset T-TEST One-Sample Statistics /TESTVAL=8 One-Sample Test /MISSING=ANALYSIS /VARIABLES=Time /CRITERIA=CI ( . 95) . + T-Test [ DataSet2] One-Sample Statistics Std. Error N Mean Std. Deviation Mean Time 15 7.3333 5.23268 1.35107 One-Sample Test Test Value = 8 95% Confidence Interval of the Mean Difference df Big. (2-tailed) Difference Lower Upper Time -.493 14 .629 .66667 -3.5644 2.2311 IBM SPSS Statistics Processor is ready Unicode:ON

Step by Step Solution

There are 3 Steps involved in it

Step: 1

blur-text-image

Get Instant Access to Expert-Tailored Solutions

See step-by-step solutions with expert insights and AI powered tools for academic success

Step: 2

blur-text-image_2

Step: 3

blur-text-image_3

Ace Your Homework with AI

Get the answers you need in no time with our AI-driven, step-by-step assistance

Get Started

Recommended Textbook for

Elementary Statisitcs

Authors: Barry Monk

2nd edition

1259345297, 978-0077836351, 77836359, 978-1259295911, 1259295915, 978-1259292484, 1259292487, 978-1259345296

More Books

Students also viewed these Mathematics questions