

Answered step by step
Verified Expert Solution
Question
1 Approved Answer
Based on those assumptions Answer those questions US health insurance system, provider payments begin{tabular}{l|l|l|l|l|l} Instructions & Assumptions & Part 1 Answer Sheet & Part 2
Based on those assumptions
Answer those questions
US health insurance system, provider payments
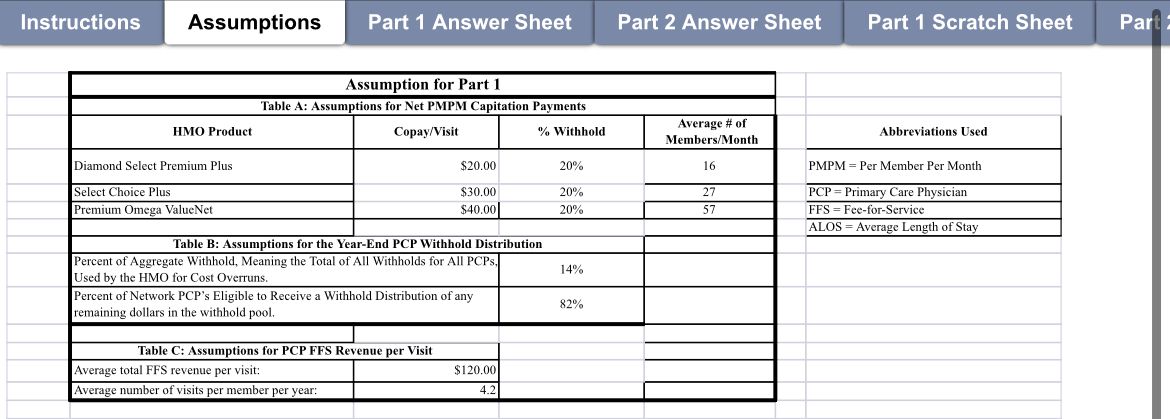
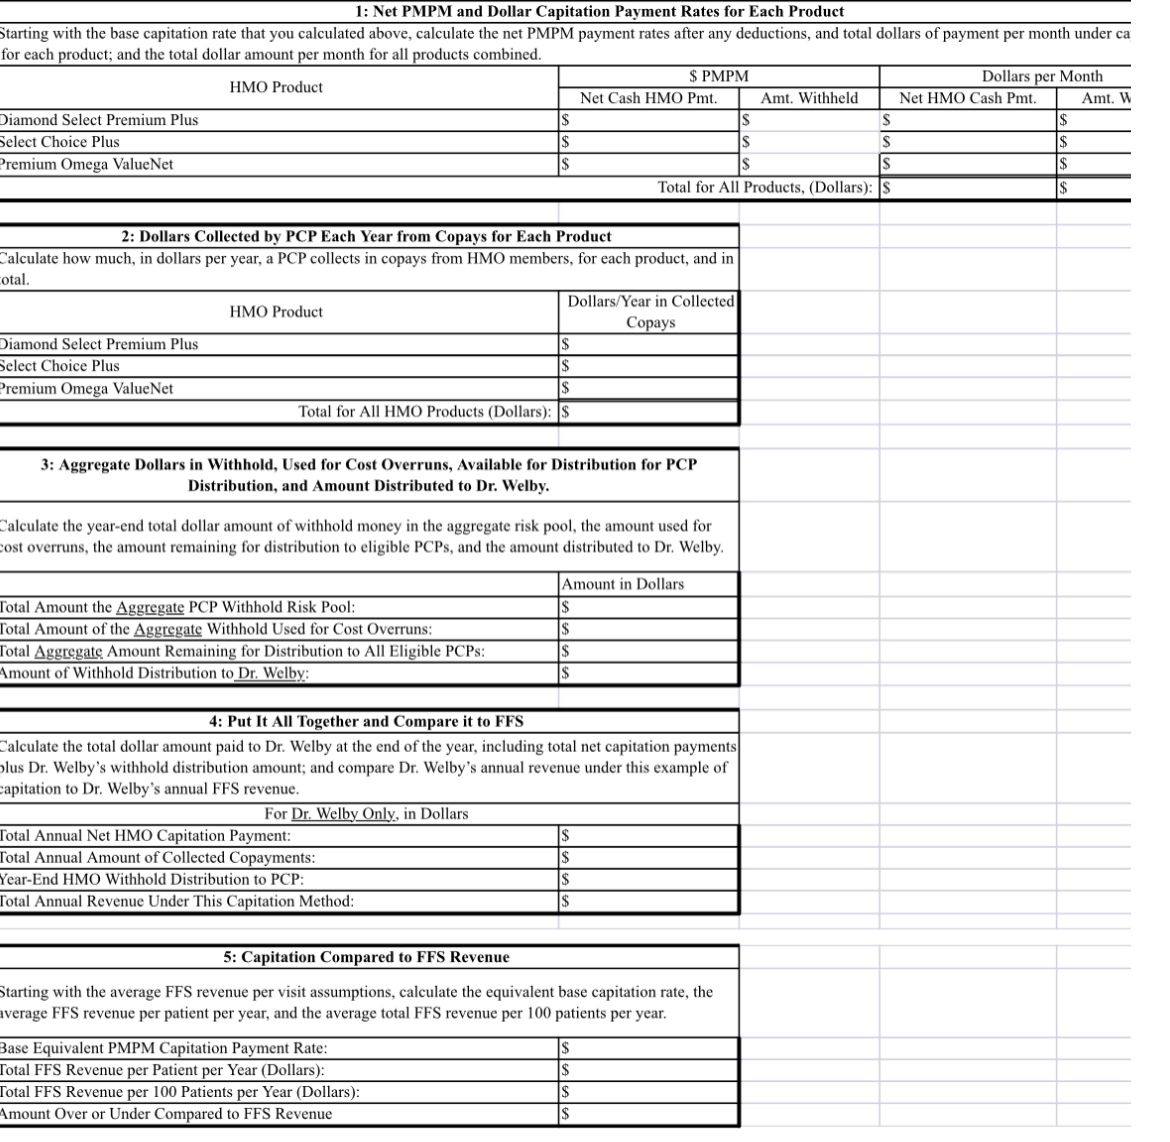
\begin{tabular}{l|l|l|l|l|l} Instructions & Assumptions & Part 1 Answer Sheet & Part 2 Answer Sheet & Part 1 Scratch Sheet & Par \\ \hline \end{tabular} \begin{tabular}{|c|c|c|c|} \hline \multicolumn{4}{|c|}{ Assumption for Part 1} \\ \hline \multicolumn{4}{|c|}{ Table A: Assumptions for Net PMPM Capitation Payments } \\ \hline HMO Product & Copay/Visit & % Withhold & \begin{tabular}{c} Average \# of \\ Members/Month \end{tabular} \\ \hline Diamond Select Premium Plus & $20.00 & 20% & 16 \\ \hline Select Choice Plus & $30.00 & 20% & 27 \\ \hline Premium Omega ValueNet & $40.00 & 20% & 57 \\ \hline \multicolumn{4}{|c|}{ Table B: Assumptions for the Year-End PCP Withhold Distribution } \\ \hline \multicolumn{2}{|c|}{\begin{tabular}{l} Percent of Aggregate Withhold, Meaning the Total of All Withholds for All PCPs, \\ Used by the HMO for Cost Overruns. \end{tabular}} & 14% & \\ \hline \multicolumn{2}{|c|}{\begin{tabular}{l} Percent of Network PCP's Eligible to Receive a Withhold Distribution of any \\ remaining dollars in the withhold pool. \end{tabular}} & 82% & \\ \hline \multicolumn{2}{|c|}{ Table C: Assumptions for PCP FFS Revenue per Visit } & & \\ \hline Average total FFS revenue per visit: & $120.00 & & \\ \hline Average number of visits per member per year: & 4.2 & & \\ \hline \end{tabular} \begin{tabular}{|l|} \hline \multicolumn{1}{|c|}{ Abbreviations Used } \\ \hline PMPM = Per Member Per Month \\ \hline PCP = Primary Care Physician \\ \hline FFS = Fee-for-Service \\ \hline ALOS = Average Length of Stay \\ \hline \\ \hline \\ \hline \end{tabular} 1: Net PMPM and Dollar Capitation Payment Rates for Each Product Starting with the base capitation rate that you calculated above, calculate the net PMPM payment rates after any deductions, and total dollars of payment per month under ca for each product: and the total dollar amount per month for all products combined. 2: Dollars Collected by PCP Each Year from Copays for Each Product Calculate how much, in dollars per year, a PCP collects in copays from HMO members, for each product, and in 3: Aggregate Dollars in Withhold, Used for Cost Overruns, Available for Distribution for PCP Distribution, and Amount Distributed to Dr. Welby. Calculate the year-end total dollar amount of withhold money in the aggregate risk pool, the amount used for cost overruns, the amount remaining for distribution to eligible PCPs, and the amount distributed to Dr. Welby. 4: Put It All Together and Compare it to FFS Calculate the total dollar amount paid to Dr. Welby at the end of the year, including total net capitation payments olus Dr. Welby's withhold distribution amount; and compare Dr. Welby's annual revenue under this example of capitation to Dr. Welby's annual FFS revenue. 5: Capitation Compared to FFS Revenue Starting with the average FFS revenue per visit assumptions, calculate the equivalent base capitation rate, the average FFS revenue per patient per year, and the average total FFS revenue per 100 patients per year. \begin{tabular}{l|l|l|l|l|l} Instructions & Assumptions & Part 1 Answer Sheet & Part 2 Answer Sheet & Part 1 Scratch Sheet & Par \\ \hline \end{tabular} \begin{tabular}{|c|c|c|c|} \hline \multicolumn{4}{|c|}{ Assumption for Part 1} \\ \hline \multicolumn{4}{|c|}{ Table A: Assumptions for Net PMPM Capitation Payments } \\ \hline HMO Product & Copay/Visit & % Withhold & \begin{tabular}{c} Average \# of \\ Members/Month \end{tabular} \\ \hline Diamond Select Premium Plus & $20.00 & 20% & 16 \\ \hline Select Choice Plus & $30.00 & 20% & 27 \\ \hline Premium Omega ValueNet & $40.00 & 20% & 57 \\ \hline \multicolumn{4}{|c|}{ Table B: Assumptions for the Year-End PCP Withhold Distribution } \\ \hline \multicolumn{2}{|c|}{\begin{tabular}{l} Percent of Aggregate Withhold, Meaning the Total of All Withholds for All PCPs, \\ Used by the HMO for Cost Overruns. \end{tabular}} & 14% & \\ \hline \multicolumn{2}{|c|}{\begin{tabular}{l} Percent of Network PCP's Eligible to Receive a Withhold Distribution of any \\ remaining dollars in the withhold pool. \end{tabular}} & 82% & \\ \hline \multicolumn{2}{|c|}{ Table C: Assumptions for PCP FFS Revenue per Visit } & & \\ \hline Average total FFS revenue per visit: & $120.00 & & \\ \hline Average number of visits per member per year: & 4.2 & & \\ \hline \end{tabular} \begin{tabular}{|l|} \hline \multicolumn{1}{|c|}{ Abbreviations Used } \\ \hline PMPM = Per Member Per Month \\ \hline PCP = Primary Care Physician \\ \hline FFS = Fee-for-Service \\ \hline ALOS = Average Length of Stay \\ \hline \\ \hline \\ \hline \end{tabular} 1: Net PMPM and Dollar Capitation Payment Rates for Each Product Starting with the base capitation rate that you calculated above, calculate the net PMPM payment rates after any deductions, and total dollars of payment per month under ca for each product: and the total dollar amount per month for all products combined. 2: Dollars Collected by PCP Each Year from Copays for Each Product Calculate how much, in dollars per year, a PCP collects in copays from HMO members, for each product, and in 3: Aggregate Dollars in Withhold, Used for Cost Overruns, Available for Distribution for PCP Distribution, and Amount Distributed to Dr. Welby. Calculate the year-end total dollar amount of withhold money in the aggregate risk pool, the amount used for cost overruns, the amount remaining for distribution to eligible PCPs, and the amount distributed to Dr. Welby. 4: Put It All Together and Compare it to FFS Calculate the total dollar amount paid to Dr. Welby at the end of the year, including total net capitation payments olus Dr. Welby's withhold distribution amount; and compare Dr. Welby's annual revenue under this example of capitation to Dr. Welby's annual FFS revenue. 5: Capitation Compared to FFS Revenue Starting with the average FFS revenue per visit assumptions, calculate the equivalent base capitation rate, the average FFS revenue per patient per year, and the average total FFS revenue per 100 patients per yearStep by Step Solution
There are 3 Steps involved in it
Step: 1

Get Instant Access to Expert-Tailored Solutions
See step-by-step solutions with expert insights and AI powered tools for academic success
Step: 2

Step: 3
Ace Your Homework with AI
Get the answers you need in no time with our AI-driven, step-by-step assistance
Get Started
The Ultimate Beginners Guide To Understanding NFTs
Authors: LM Anderson
1st Edition
1739781732, 978-1739781736