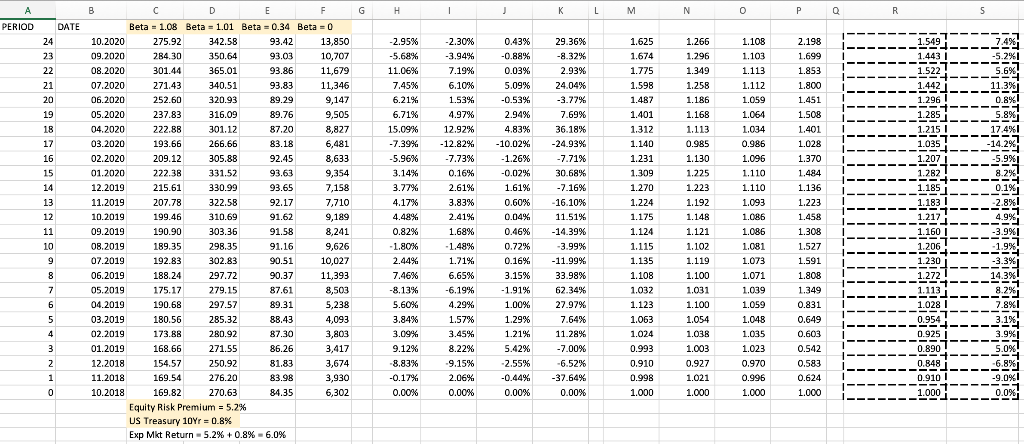
Based on two years of historic data provided by Bloomberg, calculate expected annual return, annual standard deviation and Sharpe ratio for each of the four exchange-traded funds (ETFs) portfolios (QQQ Nasdaq 100, SPY S&P 500, HYG iBoxx High Yield Bond, XBT -- Bitcoin). Hint: build up from monthly returns to annual.
| | Beta | Excepted Return |
| QQQ | 1.08 | ? |
| SPY | 1.01 | ? |
| HYG | 0.34 | ? |
| XBT | 0.0 | ? |
| US-Treasury | 0.0 | 0.8% |
| Equity Risk Premium | 1.0 | 5.2% |
| Expected Market Return | 1.0 | 6.0% |

G H 1 KL M N 0 Q R 5 PERIOD 0.43% DATE 24 23 22 21 1.108 1.103 1.266 1.296 1.349 1.258 1.186 2.198 1.699 1.853 1.800 1.451 20 1.113 1.112 1.059 1.064 1.034 1.50R -2.30% -3.94% 7.19% 6.10% 1.53% 4.97% 12.92% -12.82% -7.73% 0.16% 2.61% 3.83% 2.41% 19 18 17 16 1.401 -0.88% 0.03% 5.09% -0.53% 2.94% 4.83% -10.02% -1.26% -0.02% 1.61% 0.60% 0.04% -2.95% -5.68% 11.06% 7.45% 6.21% 6.71% 15.09% -7.39% -5.96% 3.14% 3.77% 4.17% 4.48% 0.82% -1.80% 2.44% 7.46% -8.13% 7.4% -5.2% 5.6% 11.3%) 0.8% 5.8% 17.4% -14.2% -5.9% 8.2%! 0.1% -2.8% 1.028 1.370 B C D E F Beta = 1.08 Beta = 1.01 Beta = 0.34 Beta = 0 10.2020 275.92 342.58 93.42 13,850 09.2020 284.30 350.64 93.03 10,707 08.2020 301.44 365.01 93.86 11,679 07.2020 271.43 340.51 93.83 11,346 06.2020 252.60 320.93 89.29 9,147 05.2020 237.83 316.09 89.76 9,505 04.2020 222.88 301.12 87.20 8,827 03.2020 193.66 266.66 83.18 6,481 02.2020 209.12 305.88 92.45 8,633 01.2020 222.38 331.52 93.63 9,354 12.2019 215.61 330.99 93.65 7,158 11.2019 207.78 322.58 92.17 7,710 10.2019 199.46 310.69 91.62 9,189 09.2019 190.90 303.36 91.58 8,241 08.2019 189.35 298.35 91.16 9,626 07.2019 192.83 302.83 90.51 10,027 06.2019 188.24 297.72 90.37 11,393 05.2019 175.17 279.15 87.61 8,503 04.2019 190.68 297.57 89.31 5,238 03.2019 180.56 285.32 88.43 4,093 02.2019 173.88 280.92 87.30 3,803 01.2019 168.66 271.55 86.26 3,417 12.2018 154.57 250.92 81.83 3,674 11.2018 169.54 276.20 83.98 3,930 10.2018 169.82 270.63 84.35 6,302 Equity Risk Premium = 5.2% US Treasury 10Yr = 0.8% Exp Mkt Return - 5.2% +0.8% -6.0% 15 14 13 12 11 10 9 29.36% -8.32% 2.93% 24.04% -3.77% 7.69% 36.18% -24.93% -7.71% 30.68% -7.16% -16.10% 11.51% -14.39% -3.99% -11.99% 33.98% 62.34% 27.97% 7.64% 11.28% -7.00% -6.52% -37.64% 0.00% 1.625 1.674 1.775 1.598 1.487 1.401 1.312 1.140 1.231 1.309 1.270 1.224 1.175 1.124 1.115 1.135 1.108 1.032 1.123 1.063 1.024 0.993 0.910 0.998 1.000 1.549 1.4431 1.522 1.442 1.296 1.285 1.215 ! 1.035 - 1.207 1.282 1.185 1.183 1.217 - 1.160 --224 1.206 ---- 1.230 1.272 1.168 1.113 0.985 1.130 1.225 1.223 1.192 1.148 1.121 1.102 1.119 1.100 1.031 1.100 1.054 1.038 1.003 0.927 1.021 0.986 1.096 1.110 1.110 1.093 1.086 1.086 1.081 1.073 1.071 1.039 1.059 1.048 1.035 1.68% -1.48% 1.71% 6.65% -6.19% 4.29% 1.57% 3.45% 8.22% --- 1.484 1.136 1.223 1.458 1.308 1.527 1.591 1.808 1.349 0.831 8 7 0.46% 0.72% 0.16% 3.15% -1.91% 1.00% 1.29% 1.21% 5.42% -2.55% -0.44%. 6 -3.9% .9% -3.3% 14.3% 8.2% 7.8% 3.1% % 3.9% 5.0% 5 4 5.60% 3.84% 3.09% 9.12% -8.83% -0.17% 0.00% 1.113 1.028 0.954 0.925 0.890 0.848 0.910 0.649 0.603 0.542 3 2 1 0.583 -9.15% 2.06% 0.00% 1.023 0.970 0.996 1.000 0.624 -9.0% 0.0% 0 0.00% 1.000 1.000 1.000


