-
Based on your valuation of HFC, do you believe the company was fairly valued by the market before the announcement of the sale? Calculate the WACC for HFC using the data provided in the exhibits; assume a Market Risk Premium of 5.5%. Estimate the stand-alone value of HFC using the free-cash-flow projections provided in case Exhibit 10.
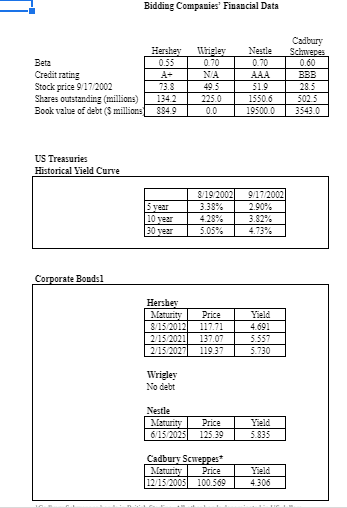
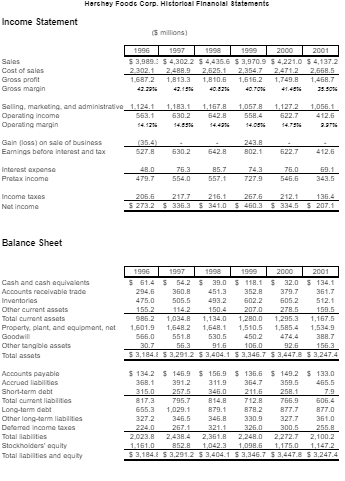
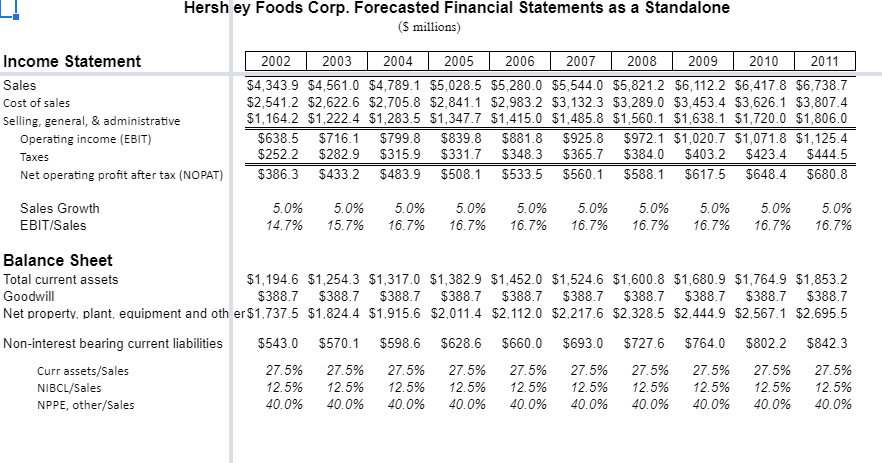
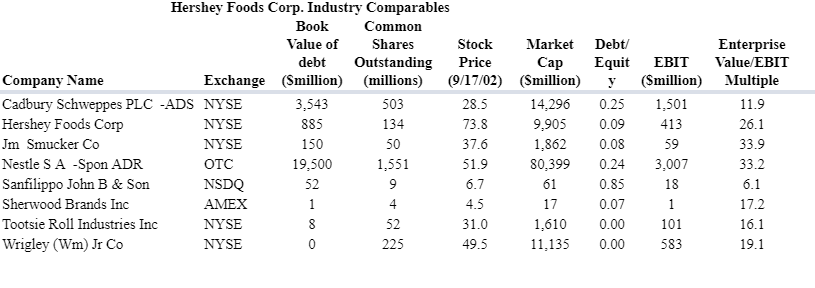
Bidding Companies' Financial Data Hershey 0.55 Beta Credit rating Stock price 9/17/2002 Shares outstanding (millions) Book value of debt (5 millions 0.70 NA 49.5 2250 0.0 73.8 1342 8949 Cadbury Schwepes 0.60 BBB 28.5 502 3 3543.0 Nestle 0.70 AAA 51.9 15506 19500.0 US Treasures Historical Yield Curve 5 year 10 year 30 year 8 19 20021 3.38% 428% 5.05% 9/17/2002 2.90% 3.82% 4.73% Corporate Bonds 1 Hershey Maturity 8/13 2012 2/15 2021 2/15 2027 Price 117.71 137.07 119.37 Yield 4.691 5.557 5.730 Wrigley No debt Nestle Maturity 6/15/2025 Price Yield 5.835 125.39 Cadbury Scweppest Maturity Price 12 15 2005 100.569 Yield 4.306 Hershey Food Corp. Hictorical Finanolal Statements Income Statement (5 millions) Sales Cost of sales Gross profit Gross margin 1996 1997 1998 1999 2000 2001 $ 3,989.0 5 4,302.2 5 4,435.6 5 3,970.9 5 4,221.0 5 4,137.2 2012.1 2418.9 2.625.1 2,354.7 2.471.2 2,668.5 1.6872 1,813.3 1,810.6 1,616.2 1,749.8 1,4587 28.9056 1.183.1 530.2 1.167.8 542.8 14.4256 1,057.8 558.4 1.1272 622.7 14.796 1,056.1 412.5 3.25 Selling, marketing and administrative 1.124.1 Operating income 563.1 Operating margin Gain floss) on sale of business 135.6) Earnings before interest and tax 527.8 243.8 802.1 530.2 542.8 622.7 412.5 Interest expense Pretax income 76.3 554.0 76.0 545.6 69.1 343.5 479.7 557.1 727.9 Income taxes Net income 205.6 $ 273.2 2177 $ 336.3 216.1 267.6 212.1 $ 341.0 $ 450.3 $ 334.5 1216 S 207. Balance Sheet Cash and cash equivalents Accounts receivable trade Inventories Other current assets Total current assets Property, plant, and equipment, net Goodwill Other tangible assets Total assets 1996 1997 1998 1999 2000 2001 $ 51.4 5 54.25 39.0 S 118.1 S 32.0 5 134.1 350.8 451.3 352.0 379.7 361.7 475.0 505.5 493.2 602.2 505.2 512.1 155.2 114.2 150.4 207.0 278.5 159.5 986.2 1,034.8 1,134,0 1,280.0 1,295.3 1,167.5 1.601.9 1,5412 1.548.1 1,510.5 1,585.4 1,5349 556.0 551.8 530.5 450.2 . 30.7 56.3 91.6 106.0 92.6 $ 3,184.8 5 3.291.2 5 3,404.1 5 3,346.7 5 3,447.8 5 3.247.4 Accounts payable Accrund liabilities Short-term debt Total current liabilities Long-term dat Other long-term liabilities Deemed income taxes Total abilities Stockholders' equity Total abilities and equity 5 134.2 $ 146.9 5 156.9 $ 136.6 5 149.2 5 133.0 358.1 391.2 311.9 3547 350.5 465.5 257.5 345.0 211.6 258.1 7.9 817.3 795.7 814.8 712.8 766.3 506.4 655.3 1,029.1 879.1 8782 877.7 877.0 327.2 345.5 346.8 330.9 327.7 361.0 224.0 267.1 321.1 326.0 300.5 255.B 2023.8 2,438.4 2,351.8 2,248.0 2,272.7 2.100.2 1.161.0 852.8 1,0423 1,098.6 1,175.0 53,184.8 5 3,291.2 5 3,404.1 53,346.7 5 3,447.8 5 3,247.4 Hersh ey Foods Corp. Forecasted Financial Statements as a Standalone (5 millions) Income Statement Sales Cost of sales Selling, general, & administrative Operating income (EBIT) Taxes Net operating profit after tax (NOPAT) 2002 2003 2004 2005 2006 2007 2008 2009 2010 2011 $4,343.9 $4,561.0 $4,789.1 $5,028.5 $5,280.0 $5,544.0 $5,821.2 $6,112.2 $6,417.8 $6,738.7 $2,541.2 $2,622.6 $2,705.8 $2,841.1 $2,983.2 $3,132.3 $3,289.0 $3,453.4 $3,626.1 $3,807.4 $1,164.2 $1,222.4 $1,283.5 $1,347.7 $1,415.0 $1,485.8 $1,560.1 $1,638.1 $1,720.0 $1,806.0 $638.5 $716.1 $799.8 $839.8 $881.8 $925.8 $972.1 $1,020.7 $1,071.8 $1,125.4 $252.2 $282.9 $315.9 $331.7 $348.3 $365.7 $384.0 $403.2 $423.4 $444.5 $386.3 $433.2 $483.9 $508.1 $533.5 $560.1 $588.1 $617.5 $648.4 $680.8 Sales Growth EBIT/Sales 5.0% 14.7% 5.0% 15.7% 5.0% 16.7% 5.0% 16.7% 5.0% 16.7% 5.0% 16.7% 5.0% 16.7% 5.0% 16.7% 5.0% 16.7% 5.0% 16.7% Balance Sheet Total current assets $1,194.6 $1,254.3 $1,317,0 $1,382.9 $1,452.0 $1,524.6 $1,600.8 $1,680.9 $1,764.9 $1,853.2 Goodwill $388.7 $388.7 $388.7 $388.7 $388.7 $388.7 $388.7 $388.7 $388.7 $388.7 Net property, plant, equipment and oth er $1,737.5 $1.824.4 $1,915.6 $2.011.4 $2.112.0 $2.217.6 $2.328.5 $2.444.9 $2.567.1 $2.695.5 Non-interest bearing current liabilities $543.0 $570.1 $598.6 $628.6 $660.0 $693.0 $727.6 $764.0 $802.2 $842.3 Curr assets/Sales 27.5% 27.5% 27.5% 27.5% 27.5% 27.5% 27.5% 27.5% 27.5% 27.5% NIBCL/Sales 12.5% 12.5% 12.5% 12.5% 12.5% 12.5% 12.5% 12.5% 12.5% 12.5% NPPE, other/Sales 40.0% 40.0% 40.0% 40.0% 40.0% 40.0% 40.0% 40.0% 40.0% 40.0% Hershey Foods Corp. Industry Comparables Book Common Value of Shares Stock Market Debt! debt Outstanding Price Cap Equit Company Name Exchange (Smillion) (millions) (9/17/02) (Smillion) Cadbury Schweppes PLC -ADS NYSE 3,543 503 28.5 14,296 0.25 Hershey Foods Corp NYSE 885 134 73.8 9,905 0.09 Im Smucker Co NYSE 50 37.6 1,862 0.08 Nestle SA -Spon ADR OTC 19,500 1,551 51.9 80,399 0.24 Sanfilippo John B & Son NSDQ 52 9 6.7 61 0.85 Sherwood Brands Inc AMEX 1 4 4.5 17 0.07 Tootsie Roll Industries Inc NYSE 8 52 31.0 1,610 0.00 Wrigley (Wm Jr Co NYSE 0 225 49.5 11,135 0.00 150 Enterprise EBIT Value/EBIT (Smillion) Multiple 1,501 11.9 413 26.1 59 33.9 3,007 33.2 18 1 17.2 101 16.1 583 19.1 6.1 Bidding Companies' Financial Data Hershey 0.55 Beta Credit rating Stock price 9/17/2002 Shares outstanding (millions) Book value of debt (5 millions 0.70 NA 49.5 2250 0.0 73.8 1342 8949 Cadbury Schwepes 0.60 BBB 28.5 502 3 3543.0 Nestle 0.70 AAA 51.9 15506 19500.0 US Treasures Historical Yield Curve 5 year 10 year 30 year 8 19 20021 3.38% 428% 5.05% 9/17/2002 2.90% 3.82% 4.73% Corporate Bonds 1 Hershey Maturity 8/13 2012 2/15 2021 2/15 2027 Price 117.71 137.07 119.37 Yield 4.691 5.557 5.730 Wrigley No debt Nestle Maturity 6/15/2025 Price Yield 5.835 125.39 Cadbury Scweppest Maturity Price 12 15 2005 100.569 Yield 4.306 Hershey Food Corp. Hictorical Finanolal Statements Income Statement (5 millions) Sales Cost of sales Gross profit Gross margin 1996 1997 1998 1999 2000 2001 $ 3,989.0 5 4,302.2 5 4,435.6 5 3,970.9 5 4,221.0 5 4,137.2 2012.1 2418.9 2.625.1 2,354.7 2.471.2 2,668.5 1.6872 1,813.3 1,810.6 1,616.2 1,749.8 1,4587 28.9056 1.183.1 530.2 1.167.8 542.8 14.4256 1,057.8 558.4 1.1272 622.7 14.796 1,056.1 412.5 3.25 Selling, marketing and administrative 1.124.1 Operating income 563.1 Operating margin Gain floss) on sale of business 135.6) Earnings before interest and tax 527.8 243.8 802.1 530.2 542.8 622.7 412.5 Interest expense Pretax income 76.3 554.0 76.0 545.6 69.1 343.5 479.7 557.1 727.9 Income taxes Net income 205.6 $ 273.2 2177 $ 336.3 216.1 267.6 212.1 $ 341.0 $ 450.3 $ 334.5 1216 S 207. Balance Sheet Cash and cash equivalents Accounts receivable trade Inventories Other current assets Total current assets Property, plant, and equipment, net Goodwill Other tangible assets Total assets 1996 1997 1998 1999 2000 2001 $ 51.4 5 54.25 39.0 S 118.1 S 32.0 5 134.1 350.8 451.3 352.0 379.7 361.7 475.0 505.5 493.2 602.2 505.2 512.1 155.2 114.2 150.4 207.0 278.5 159.5 986.2 1,034.8 1,134,0 1,280.0 1,295.3 1,167.5 1.601.9 1,5412 1.548.1 1,510.5 1,585.4 1,5349 556.0 551.8 530.5 450.2 . 30.7 56.3 91.6 106.0 92.6 $ 3,184.8 5 3.291.2 5 3,404.1 5 3,346.7 5 3,447.8 5 3.247.4 Accounts payable Accrund liabilities Short-term debt Total current liabilities Long-term dat Other long-term liabilities Deemed income taxes Total abilities Stockholders' equity Total abilities and equity 5 134.2 $ 146.9 5 156.9 $ 136.6 5 149.2 5 133.0 358.1 391.2 311.9 3547 350.5 465.5 257.5 345.0 211.6 258.1 7.9 817.3 795.7 814.8 712.8 766.3 506.4 655.3 1,029.1 879.1 8782 877.7 877.0 327.2 345.5 346.8 330.9 327.7 361.0 224.0 267.1 321.1 326.0 300.5 255.B 2023.8 2,438.4 2,351.8 2,248.0 2,272.7 2.100.2 1.161.0 852.8 1,0423 1,098.6 1,175.0 53,184.8 5 3,291.2 5 3,404.1 53,346.7 5 3,447.8 5 3,247.4 Hersh ey Foods Corp. Forecasted Financial Statements as a Standalone (5 millions) Income Statement Sales Cost of sales Selling, general, & administrative Operating income (EBIT) Taxes Net operating profit after tax (NOPAT) 2002 2003 2004 2005 2006 2007 2008 2009 2010 2011 $4,343.9 $4,561.0 $4,789.1 $5,028.5 $5,280.0 $5,544.0 $5,821.2 $6,112.2 $6,417.8 $6,738.7 $2,541.2 $2,622.6 $2,705.8 $2,841.1 $2,983.2 $3,132.3 $3,289.0 $3,453.4 $3,626.1 $3,807.4 $1,164.2 $1,222.4 $1,283.5 $1,347.7 $1,415.0 $1,485.8 $1,560.1 $1,638.1 $1,720.0 $1,806.0 $638.5 $716.1 $799.8 $839.8 $881.8 $925.8 $972.1 $1,020.7 $1,071.8 $1,125.4 $252.2 $282.9 $315.9 $331.7 $348.3 $365.7 $384.0 $403.2 $423.4 $444.5 $386.3 $433.2 $483.9 $508.1 $533.5 $560.1 $588.1 $617.5 $648.4 $680.8 Sales Growth EBIT/Sales 5.0% 14.7% 5.0% 15.7% 5.0% 16.7% 5.0% 16.7% 5.0% 16.7% 5.0% 16.7% 5.0% 16.7% 5.0% 16.7% 5.0% 16.7% 5.0% 16.7% Balance Sheet Total current assets $1,194.6 $1,254.3 $1,317,0 $1,382.9 $1,452.0 $1,524.6 $1,600.8 $1,680.9 $1,764.9 $1,853.2 Goodwill $388.7 $388.7 $388.7 $388.7 $388.7 $388.7 $388.7 $388.7 $388.7 $388.7 Net property, plant, equipment and oth er $1,737.5 $1.824.4 $1,915.6 $2.011.4 $2.112.0 $2.217.6 $2.328.5 $2.444.9 $2.567.1 $2.695.5 Non-interest bearing current liabilities $543.0 $570.1 $598.6 $628.6 $660.0 $693.0 $727.6 $764.0 $802.2 $842.3 Curr assets/Sales 27.5% 27.5% 27.5% 27.5% 27.5% 27.5% 27.5% 27.5% 27.5% 27.5% NIBCL/Sales 12.5% 12.5% 12.5% 12.5% 12.5% 12.5% 12.5% 12.5% 12.5% 12.5% NPPE, other/Sales 40.0% 40.0% 40.0% 40.0% 40.0% 40.0% 40.0% 40.0% 40.0% 40.0% Hershey Foods Corp. Industry Comparables Book Common Value of Shares Stock Market Debt! debt Outstanding Price Cap Equit Company Name Exchange (Smillion) (millions) (9/17/02) (Smillion) Cadbury Schweppes PLC -ADS NYSE 3,543 503 28.5 14,296 0.25 Hershey Foods Corp NYSE 885 134 73.8 9,905 0.09 Im Smucker Co NYSE 50 37.6 1,862 0.08 Nestle SA -Spon ADR OTC 19,500 1,551 51.9 80,399 0.24 Sanfilippo John B & Son NSDQ 52 9 6.7 61 0.85 Sherwood Brands Inc AMEX 1 4 4.5 17 0.07 Tootsie Roll Industries Inc NYSE 8 52 31.0 1,610 0.00 Wrigley (Wm Jr Co NYSE 0 225 49.5 11,135 0.00 150 Enterprise EBIT Value/EBIT (Smillion) Multiple 1,501 11.9 413 26.1 59 33.9 3,007 33.2 18 1 17.2 101 16.1 583 19.1 6.1