

Question
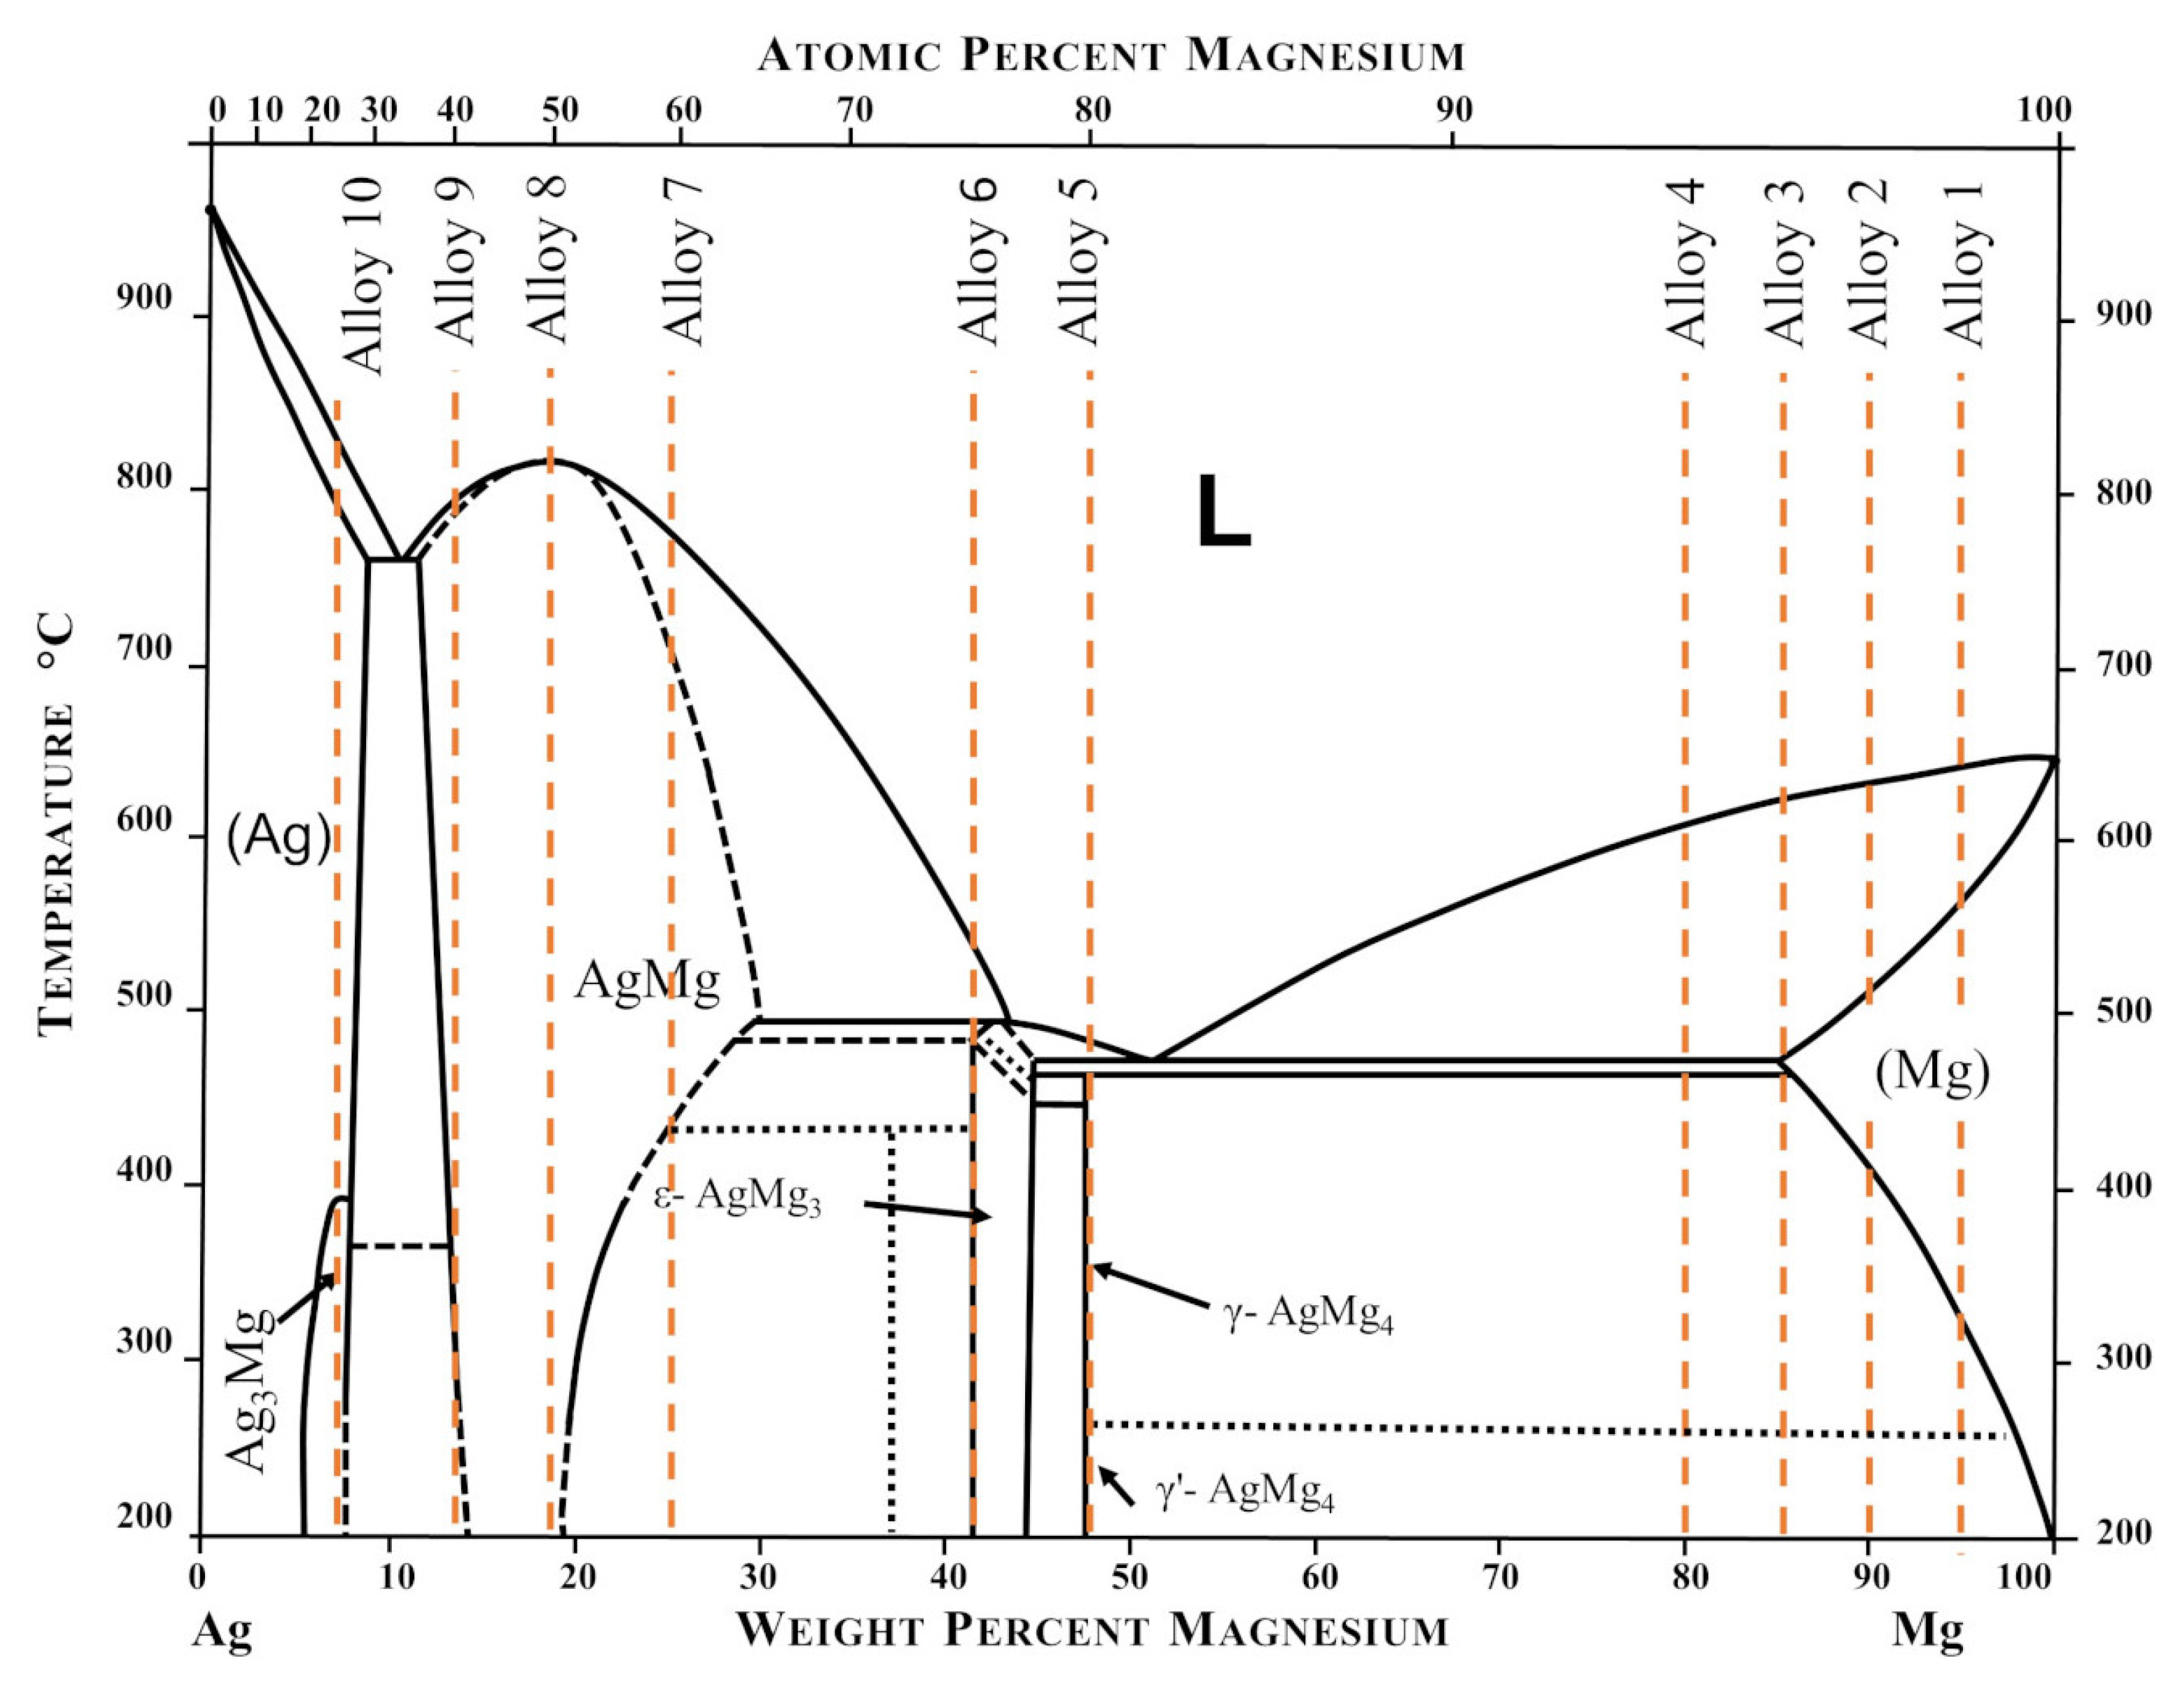
Based upon the Mg-Ag phase diagram in the figure below plot the composition vs. distance profile that would develop upon annealing a Mg/Ag diffusion couple
Based upon the Mg-Ag phase diagram in the figure below plot the composition vs. distance profile that would develop upon annealing a Mg/Ag diffusion couple at 400 C before complete equilibrium is reached. For an overall composition of Mg-30wt% Ag draw the final position of the diffusion front in a couple of length, L
Step by Step Solution
There are 3 Steps involved in it
Step: 1

Get Instant Access to Expert-Tailored Solutions
See step-by-step solutions with expert insights and AI powered tools for academic success
Step: 2

Step: 3
Ace Your Homework with AI
Get the answers you need in no time with our AI-driven, step-by-step assistance
Get Started
Introduction To Chemical Engineering Thermodynamics
Authors: J. M. Smith, Hendrick C Van Ness, Michael Abbott, Hendrick Van Ness
6th Edition
0072402962, 978-0072402964