

Question
Bayside Memorial Hospital's financial statements are presented in Exhibits 13.1, 13.2, and 13.3 in the textbook. a.) Calculate Bayside's financial ratios for 2009. Assume that
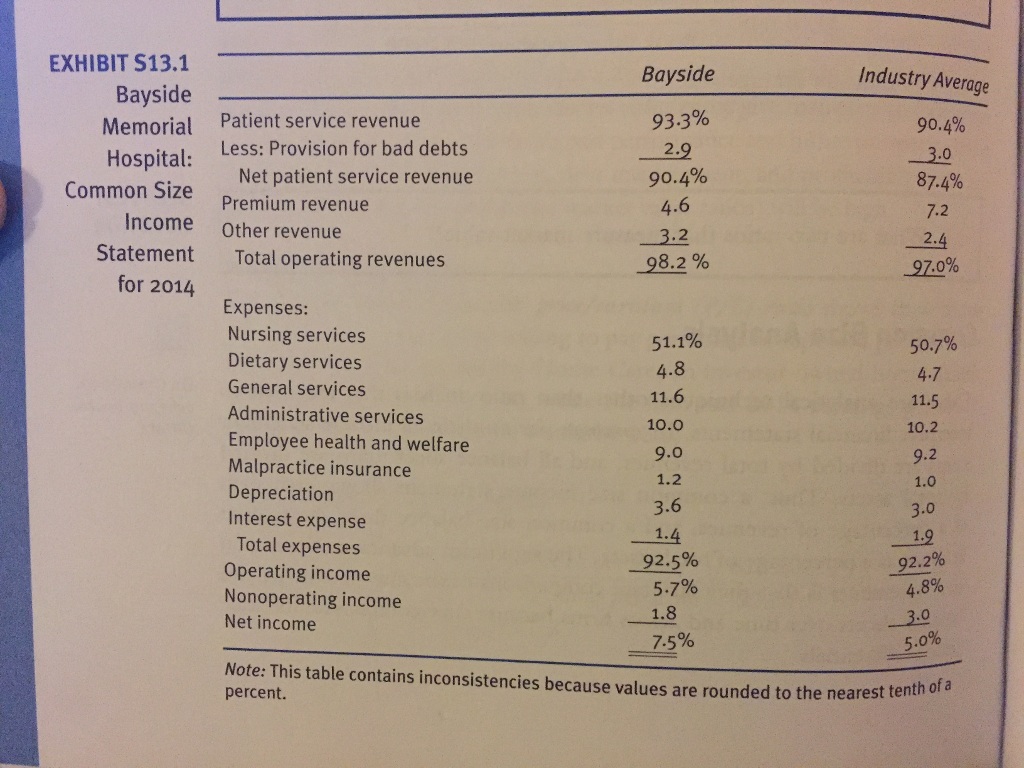
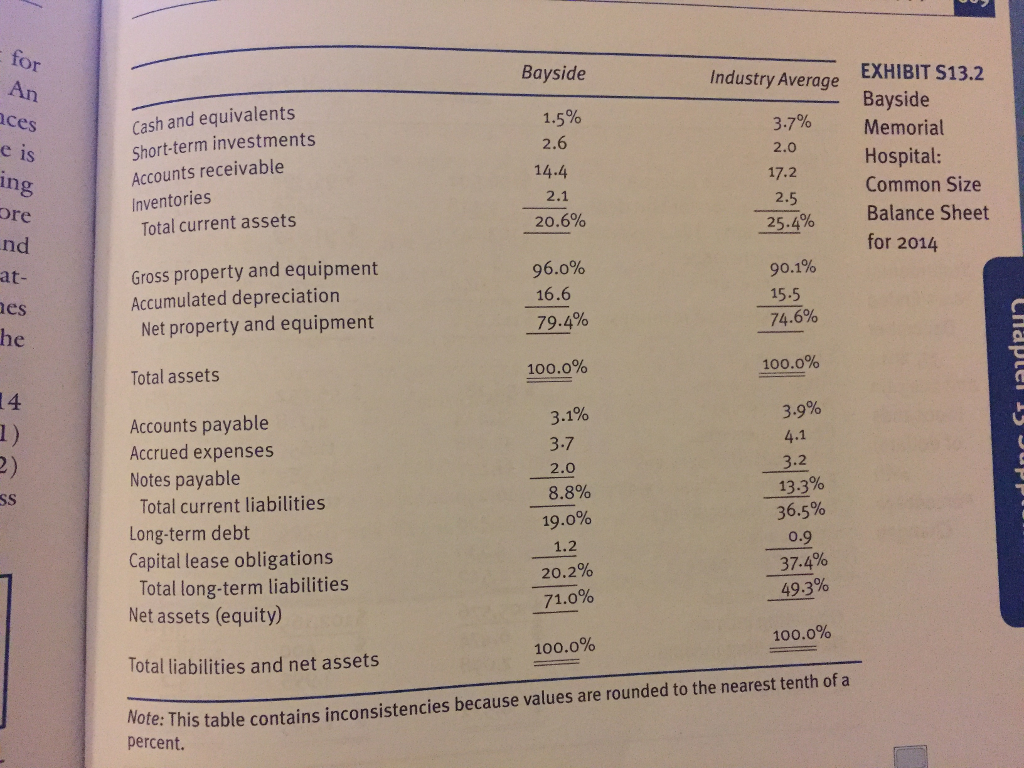
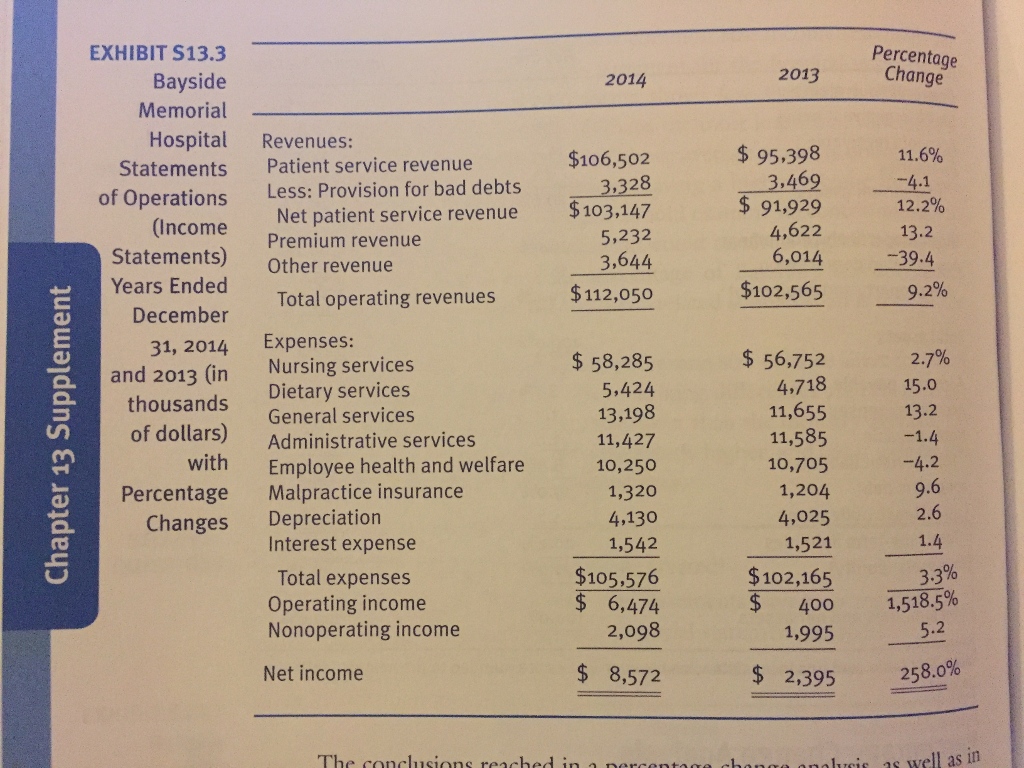
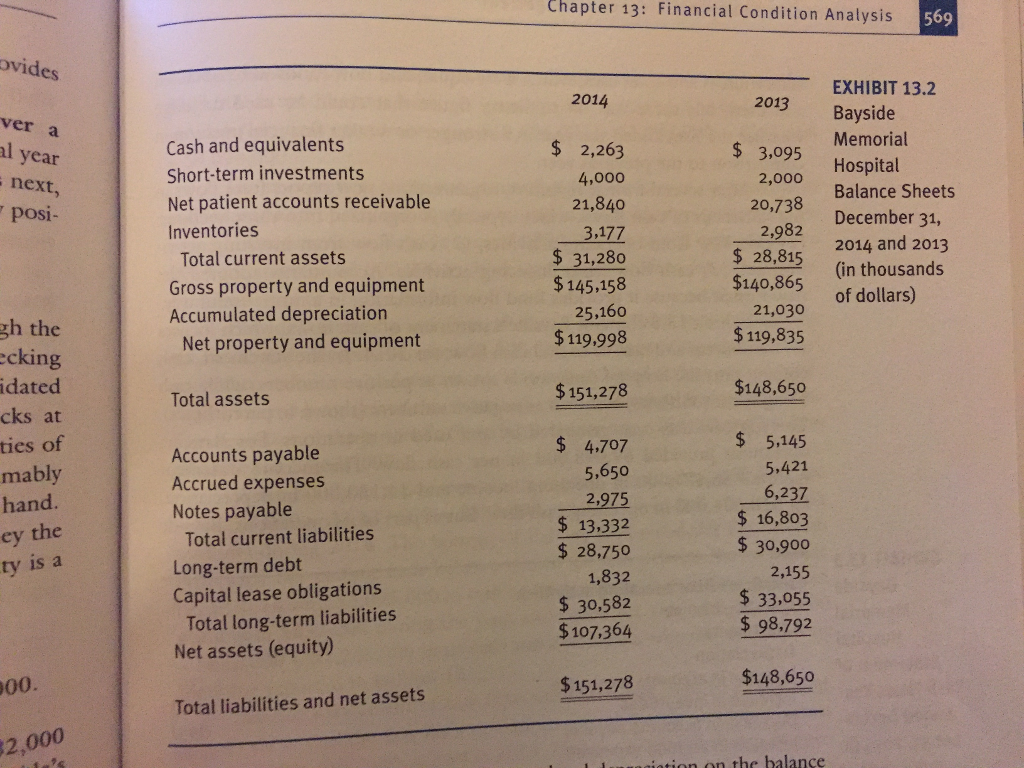
Bayside Memorial Hospital's financial statements are presented in Exhibits 13.1, 13.2, and 13.3 in the textbook.
a.) Calculate Bayside's financial ratios for 2009. Assume that Bayside had $1 million in lease payments and $1.4 million in debt principal repayments in 2013. (Hint: Use the textbook discussion to report the 2014 financila ratios and the Industry averages)
b.) Interpret the ratios. Use both trend and comparative analysis. For the comparative analysis, assume that the industry average data presented in the textbook is valid for both 2013 and 2014.
Answer a.)
| 2014 | 2013 | Industry | |
| Profitability Ratios: | |||
| Total margin = Net income / Total revenues | |||
| Return on assets = Net income / Total assets | |||
| Return on equity = Net income / Total equity | |||
| Liquidity Ratios: | |||
| Current ratio = Current assets / Current liabilities | |||
| Days cash on hand = (Cash + Marketable securities) / (Expenses - Depreciation - Uncollectibles / 365) | |||
| Debt Management Ratios: | |||
| Debt ratio = Total debt / Total assets | |||
| Debt to equity ratio = Total debt / Total equity | |||
| TIE ratio = EBIT / Interest expense | |||
| CFC ratio = (EBIT + Lease payments + Depreciation expense) / (Interest expense + Lease payments + Debt principal / (1-T)) | |||
| Asset Management Ratios: | |||
| Fixed asset turnover = Total revenues / Net fixed assets | |||
| Total asset turnover ratio = Total revenues / Total assets | |||
| Days in patient accounts receivable = (Net patient accounts receivable) / (Net patient services revenue / 365) | |||
| Other Ratios: | |||
| Average age of plant = (Accumulated depreciation) / (Depreciation Expense) | |||
Balance Sheets 2014 and 2013:
Step by Step Solution
There are 3 Steps involved in it
Step: 1

Get Instant Access to Expert-Tailored Solutions
See step-by-step solutions with expert insights and AI powered tools for academic success
Step: 2

Step: 3
Ace Your Homework with AI
Get the answers you need in no time with our AI-driven, step-by-step assistance
Get Started
Research In Finance
Authors: John W. Kensinger
1st Edition
0857245414, 978-0857245410