BBQ & Balloons
Four friends John, Paul, Ringo, and George have decided to put a stand outside a shopping centre entrance for selling barbecue and balloons to members of the public during a weekend. The enterprise was named BBQ & Balloons.
Question 1
Each barbecue is sold for $2.00 and each balloon is sold for $1.00. Throughout the two days, the four friends were able to sell 2,000 barbecues and 1,000 balloons. The four friends did not have to bother about the stock of sausage and bread or balloons. They made an arrangement with a supplier and had to pay only $0.25 per barbecue served (a slice of bread and a sausage) and $0.03 for each balloon.
For the sake of remuneration, the friends have agreed that each one would receive $400 for the two days of hard work. Besides the expense of labour and material, the four friends had other expenses for the two days. For the sake of simplicity, two expenses were related to the production process, which was leasing a BBQ ($200) and a balloon pump ($50). The other two expenses were related to sales and administrative tasks, which were leasing a gazebo ($50) and getting a permit for having the stand outside the shopping centre ($250).
Required
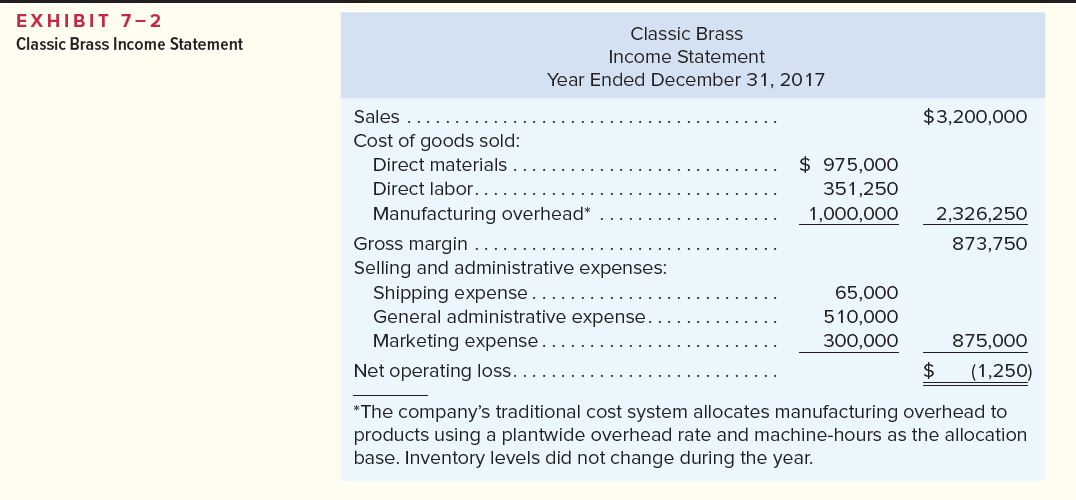
Based only on information provided in Question 1, please generate an income statement for BBQ & Balloons (suggestion: use Exhibit 7-2 below as a model).
Question 2
John and Paul spent most of their time preparing the barbecues or inflating balloons, whereas Ringo and George were busy with sales and administrative tasks. The table below has information regarding the four friends' activities over the weekend.
Table 1- Activity
| person | Operating BBQ | Inflating balloons | Cashier | Greeting customers | Total |
| John | 75% | 10% | 5% | 10% | 100% |
| Paul | 25% | 75% | 0% | 0% | 100% |
| Ringo | 10% | 30% | 50% | 10% | 100% |
| George | 0% | 20% | 5% | 75% | 100% |
John spent most of this time during the two days operating the BBQ, Paul was mostly busy inflating balloons, Ringo was responsible for the cashier, and George has spent most of his time greeting and liaising customers who were passing by. For calculating an activity rate the friends have decided to use the following cost drivers; for operating the BBQ the number of barbecues sold, for inflating balloons the number of balloons sold, and for cashier and greeting customers the total 3,000 units of BBQ and balloons sold.
Required
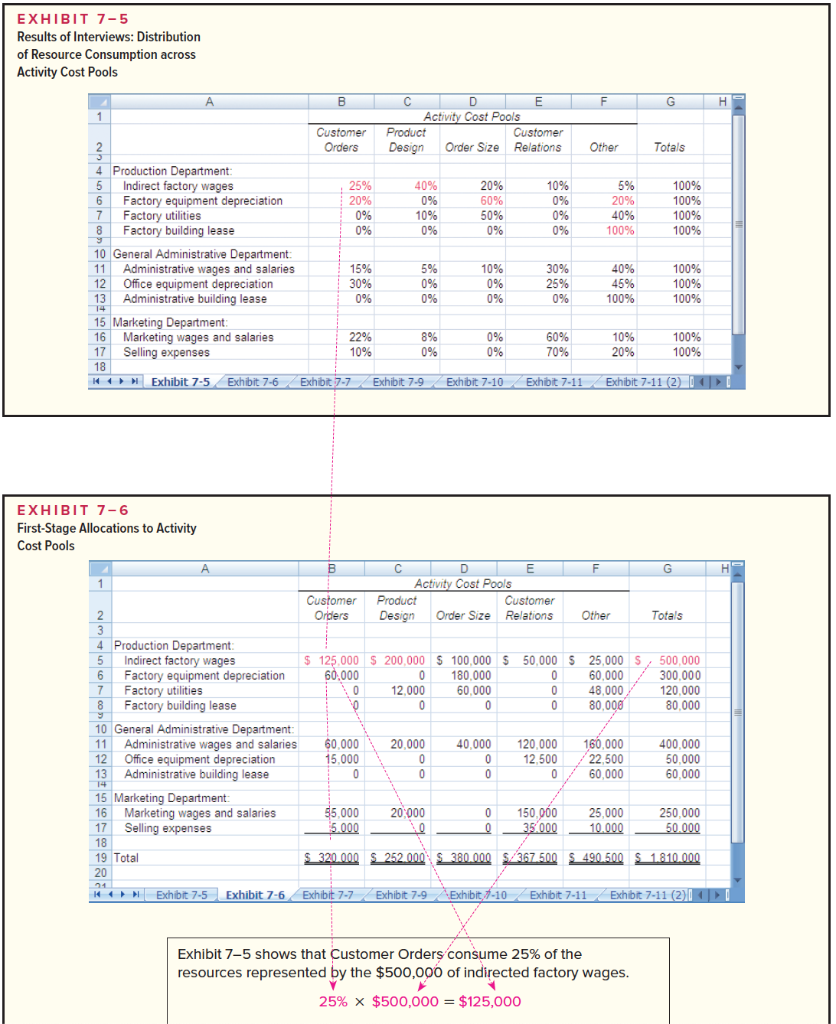
a) Considering four cost pool activities (operating the BBQ, inflating balloons, cashier, and greeting customers) prepare a table with the labour cost per person and total labour costs (suggestion: use Exhibit 7-6 as a model).
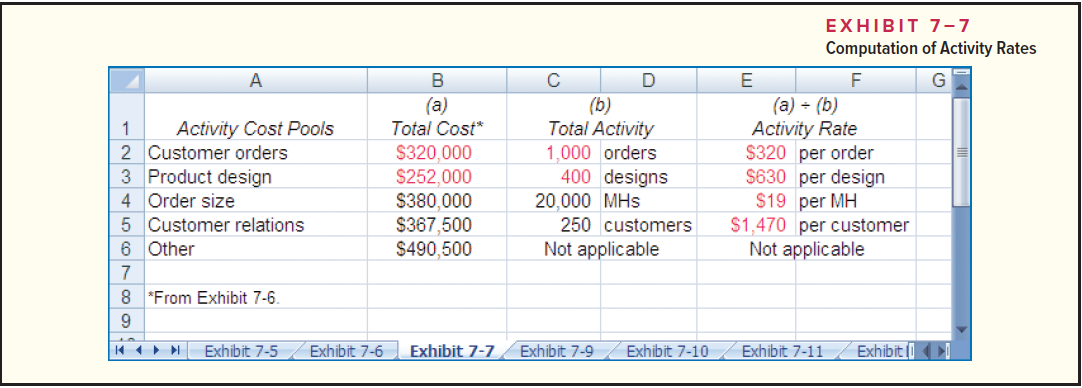
b) Calculate the activity rate for each of the labour cost pool activities (suggestion: use Exhibit 7-7 as a model) and identify which of the four cost pool activities is most expensive and why?
c) Prepare an activity-based costing product margin for the sales of barbecues and balloons (suggestion: use Exhibit 7-11 as a model). For the sake of simplicity, consider the manufacturing overhead and sales and administrative tasks as untraceable expenses and do not include them.
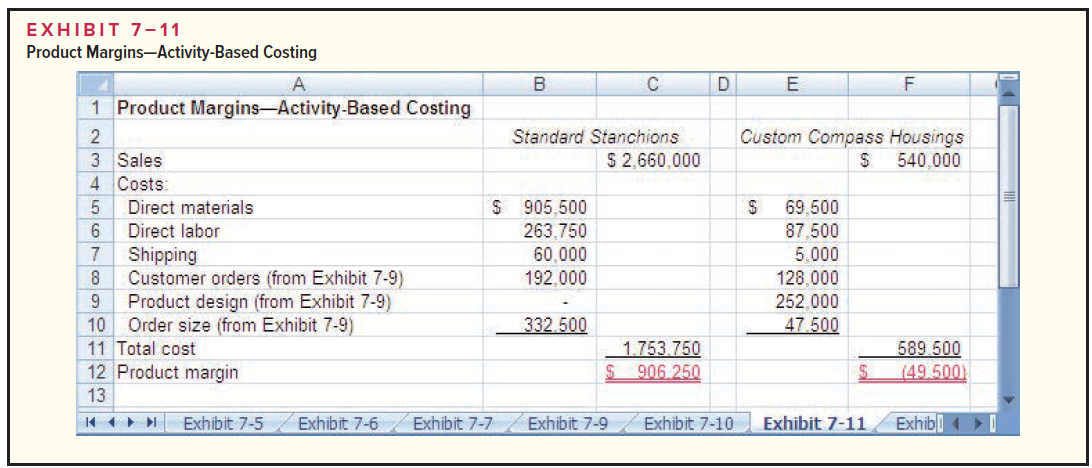
EXHIBIT 7-2 Classic Brass Income Statement Classic Brass Income Statement Year Ended December 31, 2017 Sales ............................ $3,200,000 Cost of goods sold: Direct materials ......... $ 975,000 Direct labor. 351,250 Manufacturing overhead* ..... 1,000,000 2,326,250 Gross margin 873,750 Selling and administrative expenses: Shipping expense..... 65,000 General administrative expense. 510,000 Marketing expense....... 300,000 875,000 Net operating loss............... $ (1,250) * The company's traditional cost system allocates manufacturing overhead to products using a plantwide overhead rate and machine-hours as the allocation base. Inventory levels did not change during the year. EXHIBIT 7-5 Results of Interviews: Distribution of Resource Consumption across Activity Cost Pools A B F G H C D E Activity Cost Pools Product Customer Design Order Size Relations Customer Orders Other Totals 4 Production Department: 5 Indirect factory wages 6 Factory equipment depreciation 7 Factory utilities 8 Factory building lease 40% 0% 10% 0% 20% 60% 50% 0% 10% 0% 0% 5% 20% 40% 100% 100% 100% 100% 100% 0% 0% 10 General Administrative Department: Administrative wages and salaries 12 Office equipment depreciation 13 Administrative building lease 15% 30% 0% 5% 0% 10% 0% 0% 30% 25% 0% 40% 45% 100% 100% 100% 100% 0% 15 Marketing Department: 16 Marketing wages and salaries 17 Selling expenses 22% 10% 8% 0% 0% 0% 60% 70% 10% 20% 100% 100% H1 N Exhibit 7-5 Exhibit 7-6 Exhibit 7-7 Exhibit 7.9 Exhibit 7-10 Exhibit 7-11 Exhibit 7-11 (2) EXHIBIT 7-6 First-Stage Allocations to Activity Cost Pools B F G H C D E Activity Cost Pools Product Customer Design Order Size Relations Customer Orders Other Totals $ 50,000 $ $ 125,000 60,000 $ 200,000 $100,000 0 180,000 12.000 60.000 4 Production Department: 5 Indirect factory wages 6 Factory equipment depreciation 7 Factory utilities 8 Factory building lease 10 General Administrative Department: 11 Administrative wages and salaries 12 Office equipment depreciation 13 Administrative building lease 25,000 $, 500,000 60,000 300,000 48,000 120.000 80,000 80,000 0 0 60.000 15,000 0 20.000 0 40,000 0 120,000 12.500 160,000 22.500 60,000 400,000 50,000 60,000 55,000 20 000 5.000 O 0 150,000 _35.000 25,000 - 10.000 - 250,000 50.000 15 Marketing Department: 16 Marketing wages and salaries 17 Selling expenses 18 19 Total 20 N Exhibit 7-5 Exhibit 7-6 $ 320.000 S 252.000 S 380.000 S4367.500 S 490.500 S 1.810.000 H Exhibit 7-7 Exhibit 7-9 Exhibit, 1-10 Exhibit 7-11 Exhibit 7-11 (2) Exhibit 7-5 shows that Customer Orders consume 25% of the resources represented by the $500,000 of indirected factory wages. 25% EXHIBIT 7-2 Classic Brass Income Statement Classic Brass Income Statement Year Ended December 31, 2017 Sales ............................ $3,200,000 Cost of goods sold: Direct materials ......... $ 975,000 Direct labor. 351,250 Manufacturing overhead* ..... 1,000,000 2,326,250 Gross margin 873,750 Selling and administrative expenses: Shipping expense..... 65,000 General administrative expense. 510,000 Marketing expense....... 300,000 875,000 Net operating loss............... $ (1,250) * The company's traditional cost system allocates manufacturing overhead to products using a plantwide overhead rate and machine-hours as the allocation base. Inventory levels did not change during the year. EXHIBIT 7-5 Results of Interviews: Distribution of Resource Consumption across Activity Cost Pools A B F G H C D E Activity Cost Pools Product Customer Design Order Size Relations Customer Orders Other Totals 4 Production Department: 5 Indirect factory wages 6 Factory equipment depreciation 7 Factory utilities 8 Factory building lease 40% 0% 10% 0% 20% 60% 50% 0% 10% 0% 0% 5% 20% 40% 100% 100% 100% 100% 100% 0% 0% 10 General Administrative Department: Administrative wages and salaries 12 Office equipment depreciation 13 Administrative building lease 15% 30% 0% 5% 0% 10% 0% 0% 30% 25% 0% 40% 45% 100% 100% 100% 100% 0% 15 Marketing Department: 16 Marketing wages and salaries 17 Selling expenses 22% 10% 8% 0% 0% 0% 60% 70% 10% 20% 100% 100% H1 N Exhibit 7-5 Exhibit 7-6 Exhibit 7-7 Exhibit 7.9 Exhibit 7-10 Exhibit 7-11 Exhibit 7-11 (2) EXHIBIT 7-6 First-Stage Allocations to Activity Cost Pools B F G H C D E Activity Cost Pools Product Customer Design Order Size Relations Customer Orders Other Totals $ 50,000 $ $ 125,000 60,000 $ 200,000 $100,000 0 180,000 12.000 60.000 4 Production Department: 5 Indirect factory wages 6 Factory equipment depreciation 7 Factory utilities 8 Factory building lease 10 General Administrative Department: 11 Administrative wages and salaries 12 Office equipment depreciation 13 Administrative building lease 25,000 $, 500,000 60,000 300,000 48,000 120.000 80,000 80,000 0 0 60.000 15,000 0 20.000 0 40,000 0 120,000 12.500 160,000 22.500 60,000 400,000 50,000 60,000 55,000 20 000 5.000 O 0 150,000 _35.000 25,000 - 10.000 - 250,000 50.000 15 Marketing Department: 16 Marketing wages and salaries 17 Selling expenses 18 19 Total 20 N Exhibit 7-5 Exhibit 7-6 $ 320.000 S 252.000 S 380.000 S4367.500 S 490.500 S 1.810.000 H Exhibit 7-7 Exhibit 7-9 Exhibit, 1-10 Exhibit 7-11 Exhibit 7-11 (2) Exhibit 7-5 shows that Customer Orders consume 25% of the resources represented by the $500,000 of indirected factory wages. 25%


