

Question
B/E AEROSPACE, INC. INTRODUCTION In the fall of 2004, management at B/E Aerospace, Inc. (NASDAQ: BEAV) was reviewing the company's financial strategy, after having barely
B/E AEROSPACE, INC.
INTRODUCTION
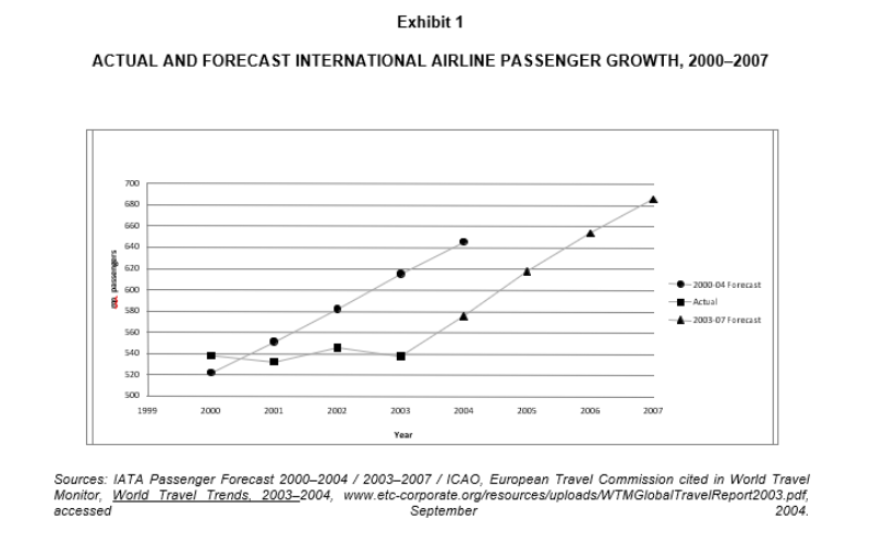
In the fall of 2004, management at B/E Aerospace, Inc. (NASDAQ: BEAV) was reviewing the company's financial strategy, after having barely survived a significant post-9/11 downturn in its primary business of building commercial and business jet airplane cabin interiors. Because passenger miles flown were expected to return to pre-9/11 levels, the concomitant need to refurbish cabin interiors and to equip new jets for air carriers around the world encouraged management that the company could return to profitability in 2005. Airlines, which were BEAV's major customers, were expected to increase their purchases to meet increasing demand, a reflection of their improved financial situations. BEAV had approximately 40 per cent of the global airplane seat business, and it expected to increase 2005 sales above the $700 million level forecast for 2004 (see Exhibit 1 for international airline passenger growth information). At the end of September 2004, the order backlog was $615 million.
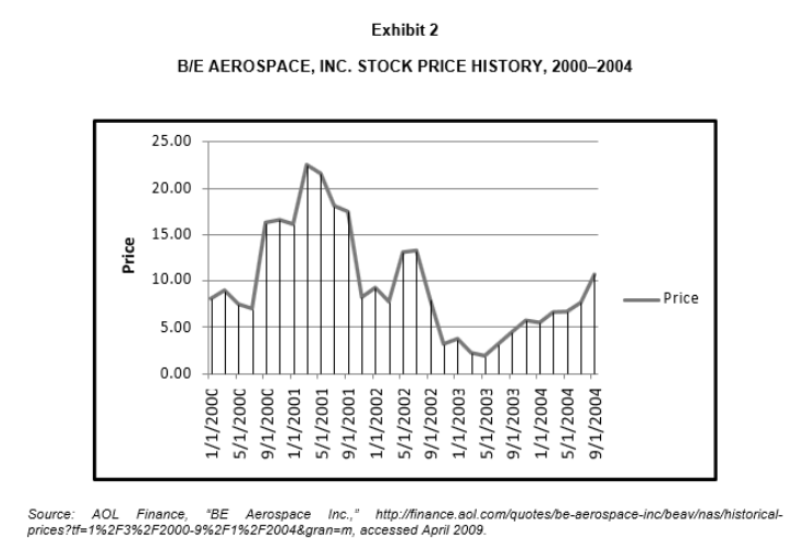
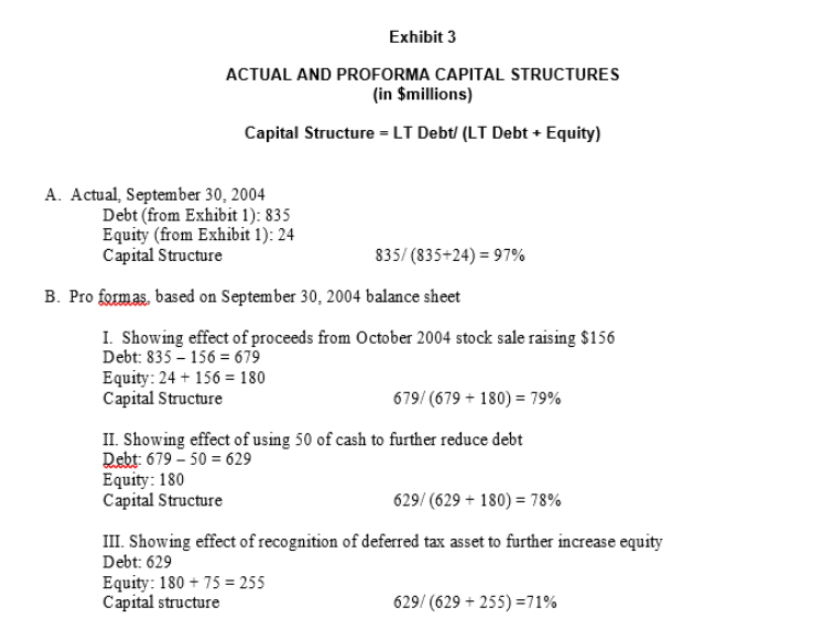
In October 2004, the company completed the sale of 18.4 million shares of common stock, which raised $156 million (see Exhibit 2 for BEAV stock price history). BEAV was committed to using these funds to pay down some of its high-yield debt to reduce interest expense and to achieve a more balanced capital structure. After this capital restructuring, debt on a pro forma basis would constitute 79 per cent of BEAV's long-term capital, a significant improvement from the 97 per cent debt ratio before the restructuring (see Exhibit 3 for capital structure information). In preparation for an upcoming board meeting, Tom McCaffrey, chief financial officer (CFO), began investigating the appropriate debt target for BEAV. One of the main questions on his mind was whether the company should use some of its cash to further reduce its debt expense.
HISTORY
B/E Aerospace, Inc. (BEAV) was founded in 1987 by a group of investors led by the company president and chairman, Amin Khoury, and his brother, the chief operating officer, Robert Khoury. The company grew from sales of less than $3 million to approximately $625 million in 2003. The company went public in 1989. BEAV had grown both internally and through the acquisition of 26 businesses over a 15-year period at a total cost of $1 billion. Acquisitions expanded the capabilities in BEAV's existing business lines and allowed the company to enter new lines of related businesses, such as the manufacture of airline seats, galley equipment, oxygen equipment and other interior products.
BEAV posted losses in fiscal 1995 and 1996, primarily because of a write-down related to the introduction of its interactive Multimedia Digital Distribution System, an in-flight entertainment system, just as the airline industry was slumping. BEAV sold this business in 2000 and focused on broadening its product lines and boosting sales through upgrades, maintenance and other services.
After the airline industry began to recover in 1997, BEAV acquired the leading manufacturers of business jet seating, lighting and oxygen products. However, as a result of the integration of these businesses, BEAV incurred production problems in its commercial seat manufacturing operations, resulting in delayed deliveries to customers, increased rework of seat products, penalties and out-of-sequence charges. After some airlines turned to other competitors, the company decided to rationalize its seating business, product offerings and operations, which resulted in a net loss for the year 1999.
In September 2001, BEAV entered the aftermarket aerospace fastener distribution business through the acquisition of M & M Aerospace Hardware. Later in the year, the company announced that it would close five facilities and cut 30 per cent of its workforce (approximately 1,500 people) because of the dramatic slowdown in the airline industry after the terrorist attacks of September 11. BEAV completed its restructuring in 2003.
BEAV Financing
At various dates prior to the fall of 2001, BEAV incurred $700 million of subordinated debt at interest rates ranging from 8 per cent to 9.5 per cent. The first repayment was not due until 2008. Repayment of some of these loans was restricted, but these restrictions could be overcome for a fee. The funds had been raised primarily to finance acquisitions, to integrate the businesses and to provide a cushion for unforeseen adversity.
The Company in 2004
BEAV described its business as follows:
We are the world's leading manufacturer of cabin interior products for commercial aircraft and business jets, and a leading aftermarket distributor of aerospace fasteners. Selling directly to the world's airlines, we offer the industry's broadest product line. We also provide aircraft cabin interior design, reconfiguration, and passenger-to-freighter conversation services.1
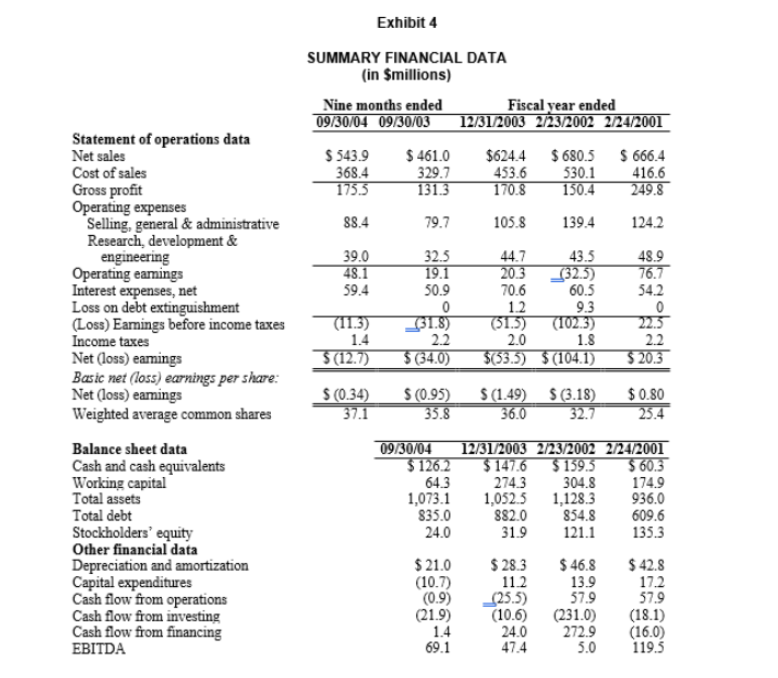
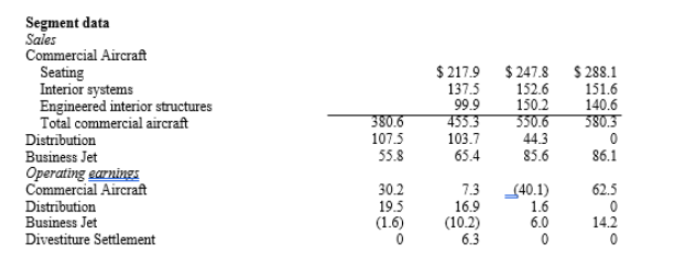
BEAV had net sales of $543.9 million for the nine months ended September 30, 2004 and net sales of $624.4 million for fiscal year 2003 (see Exhibit 4). The company's three business segments were Commercial Aircraft, Business Jets and Fastener Distribution. In the first nine months of 2004, the segments' shares of total revenues were approximately 70 per cent, 10 per cent and 20 per cent, respectively. The largest contributor to operating earnings was the Commercial Aircraft segment at 60 per cent. The remaining 40 per cent came from Fastener Distribution segment, and the Business Jets segment operated at break-even. BEAV had 15 manufacturing facilities in the United States and Europe and employed approximately 3,400 people. It had achieved leading global market positions in each of its major product categories.
BEAV derived its revenue from two primary sources: 1) refurbishment and upgrade programs for the existing worldwide fleets of commercial and general aviation aircraft and 2) new aircraft deliveries. Historically, approximately 60 per cent of its revenue came from the aftermarket and 40 per cent from new aircraft deliveries. Airlines continued both to purchase spare parts for refurbishment and to retrofit programs from their original supplier. BEAV's large installed base and its large engineering and product support organization served as both significant barriers to entry and strong selling points to its customers.
BEAV generated approximately 50 per cent of its total revenue from sales outside the United States for the nine-month period ended September 30, 2004: approximately 21 per cent of total revenues were generated in Europe and 19 per cent in Asia.
Business Strategy
BEAV's business strategy was to maintain a leadership position and to best serve customers by:
? Offering the broadest and most innovative products and services in the industry; ? Offering the broadest range of engineering services in the industry, including aircraft reconfiguration, passenger-to-freighter conversion capabilities and design, integration, installation and certification services; ? Pursuing the highest level of quality in every facet of its operations, from the factory floor to customer support; ? Aggressively pursuing initiatives of continuous improvement of manufacturing operations to reduce cycle time, lower costs, improve quality and expand margins; and ? Pursuing a worldwide marketing and product support approach focused by airline and general aviation airframe manufacturers, encompassing the entire product line.
New product development was a strategic tool for BEAV. Management believed these activities, if properly focused and managed, would protect and enhance its leadership position in the airline industry. Research, development and engineering spending were between 6 per cent and 7 per cent of net sales and were expected to remain at this level. The research effort produced several new products, including a new super first-class product much like a first-class train compartment, an economy-class platform seat called "Spectrum," a new mini-pod lie-flat business-class seat, beverage makers and LED lighting systems. These new products, which had higher embedded margins than the legacy products they replaced, coupled with the company's ongoing cost-reduction programs, were expected to result in continued margin expansion.
INDUSTRY OVERVIEW
During calendar year 2003, the commercial and business jet cabin interior products and aerospace-grade fastener distribution industries had combined annual sales of more than $1.1 billion and $1.2 billion, respectively. The total worldwide installed base of commercial and general aviation aircraft cabin interior product was $15 billion as of June 30, 2004. Reflective of improving market conditions for its aircraft cabin products, BEAV's backlog was $615 million on September 30, 2004, up 23 per cent from a year earlier.
Commercial Aircraft Industry
Following a 16 per cent downturn in air travel in 2001, the commercial airline industry saw an upturn in air travel in 2003, bringing global revenue passenger miles back to pre-9/11 levels. The positive trend continued in the first half of 2004 as global air traffic increased by approximately 20 per cent over the first half of 2003, led by growth of approximately 44 per cent in the Middle East, 35 per cent in Asia-Pacific and 20 per cent in North America. In response to this increase in passenger traffic, the global airline industry increased capacity by approximately 13 per cent during the first half of 2004, led by capacity growth of approximately 34 per cent in the Middle East, 19 per cent in Asia-Pacific and 12 per cent in North America.
Increased passenger traffic and associated increases in airline capacity were expected to initially benefit providers of aftermarket products and services, as grounded aircrafts were brought back into service and existing aircraft required additional maintenance, repairs and upgrades. Increases in original equipment manufacturer (OEM) production rates were also expected. New deliveries of large commercial aircraft were expected to grow from 573 in 2003 to 605 in 2004, and then to 670 in 2005, 775 in 2006, 800 in 2007 and 835 in 2008.2
Growth prospects for the commercial aircraft industry remained strong for the long term. Industry sources projected worldwide air traffic growth at a compounded average rate of 5.6 per cent during the 2003-2020 period, which would increase annual revenue passenger miles from approximately two trillion in 2003 to approximately five trillion in 2020. Such growth would require a substantial expansion of the worldwide aircraft fleet, which was expected to double over the same period. Much of this growth would be in wide-body aircraft, which required up to five times greater investment in BEAV's products as narrow body aircraft.
Business Jet Industry
The business jet industry experienced a severe downturn in early 2000, driven by weak economic conditions and poor corporate profits. Industry forecasts, however, projected moderate growth in the business jet industry in the near-term, with total deliveries of 565 aircraft in 2004 and 586 aircraft in 2005, an increase of 11 per cent and 15 per cent, respectively, over the 510 aircraft delivered in the trough year of 2003. In addition, industry sources estimated that approximately 7,700 business jets would be built between 2003 and 2013, at a value of more than $115 billion and with estimated cabin interior product content of approximately $2.5 billion.
Aircraft-Grade Fasteners
Every screw, nut, bolt, clip and other fastener used in an aircraft had to be certified by the Civil Aeronautics Board. Certified fasteners were used in both manufacturing and repair work. BEAV's fastener division manufactured these required fasteners in a modern, fully computerized and automated facility located in Miami. Next-day delivery could be made to any part of the world. Sales of fasteners were directly proportional to increase in airline traffic.
Competition
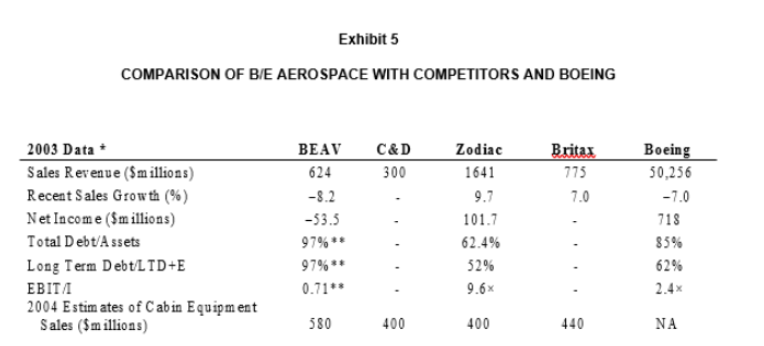
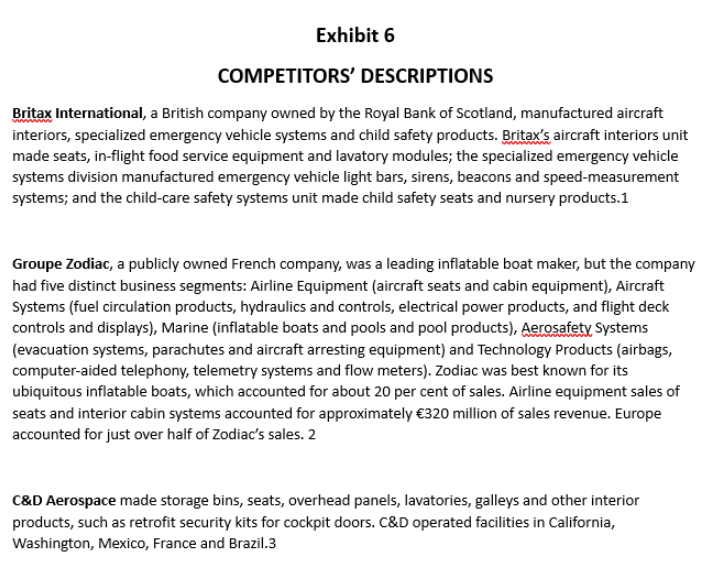
BEAV had several principal competitors in the commercial aircraft industry (see Exhibit 5). Two of the most significant competitors were Britax International (Britax) and C&D Aerospace (C&D). Both companies were privately owned and, therefore, were not required to disclose financial data. Another major competitor was Groupe Zodiac, a publicly owned company based in France (see Exhibit 6).3
Future Funds Needs
Management at BEAV believed that the company's existing manufacturing plants could handle sales 50 per cent higher than those posted in 2003. As a result, funds required for expansion purposes would mainly relate to net working capital, which could be covered from depreciation funds not applied to plant maintenance. Security analysts had forecast a return to profitability in 2005 with earnings of approximately $28 million and possibly twice that level in 2006. Revenues were expected to grow at an annual rate of 10 per cent after 2004. Correspondingly, operating margins and net income would increase as a result of higher embedded margins and greater use of available manufacturing capacity.
Management wondered how it should use the company's anticipated higher future cash flows. A bank line of credit in the amount of $50 million had been secured, the maximum amount then permitted by a BEAV bond indenture. The company had not yet recorded a deferred tax asset4 related to its net operating losses. When this deferred tax asset was recorded, the company's debt-to-capital ratio would decrease by approximately 5 per cent. Management believed that it would be appropriate to record a $75 million deferred tax asset in 2007, which would result in a one-time income benefit of the same amount (in excess of $1.00 per share). The deferred tax asset could be recognized sooner than 2007 if profits materialized that management believed could be applied against the losses carried forward (the impact of the September 30, 2004 capital structure on decisions management to improve the company's capital structure is summarized in Exhibit 3). These projections did not recognize any penalty associated with early debt reduction, interest savings on retired debt or costs of raising new capital.
Going forward, questions remained about the proportion of capital that should be debt. After the recent stock sale, the amount would need to be revised downward from the 79 per cent originally projected by the company. What would be a reasonable level for an aftermarket supplier in a cyclical industry?
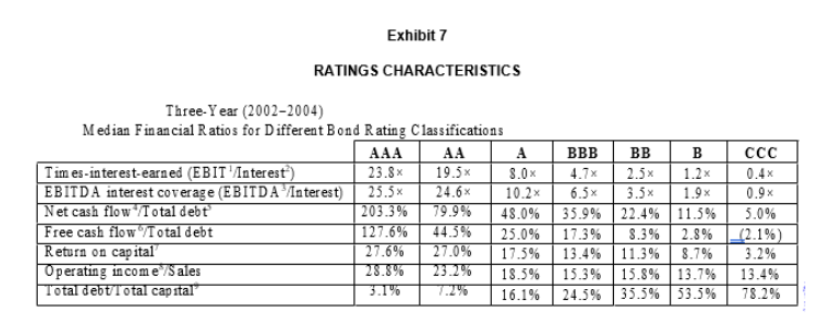
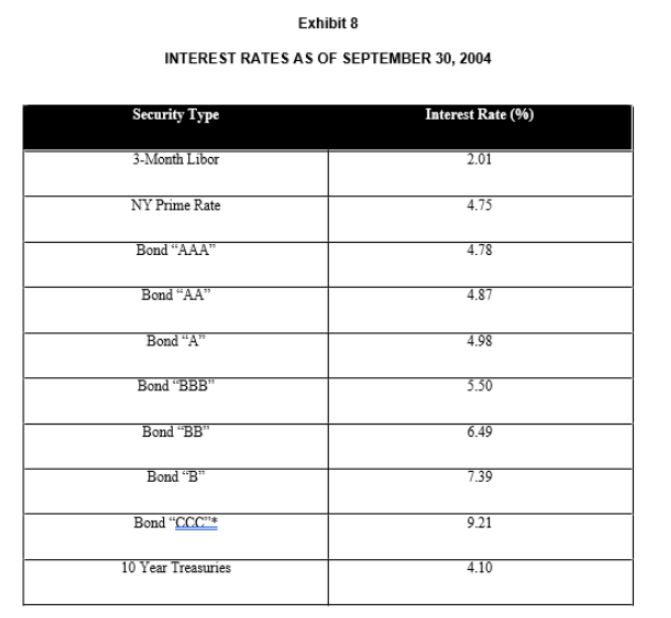
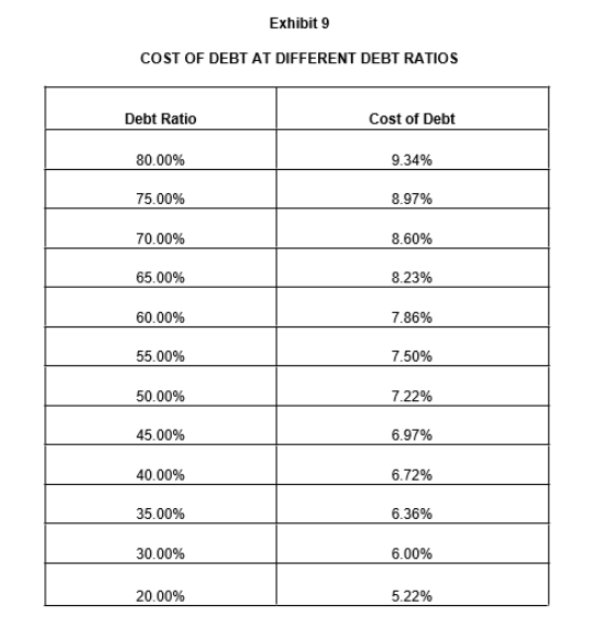
Management could establish a goal of having a capital structure similar to the Boeing Company or one of BEAV's other competitors (see Exhibit 5). With the knowledge that a higher debt rating meant lower interest rates on future borrowings, management could frame its desired capital structure to achieve a target bond rating or to minimize the cost of capital. Management estimated the company's common stock beta at the end of September 2004 at 1.95, which reflected a potential debt reduction to 79 per cent (see Exhibit 7 for information on financial characteristics of companies with various debt ratings; see Exhibit 8 for information on yields of bonds with different ratings). Additionally, management expected cost of debt at different debt levels to vary (see Exhibit 9).
In the future, a further reduction in expensive long-term debt was possible through retained earnings. The company was wrestling with the issue of how to achieve its target capital structure. Tom McCaffrey had several questions on his mind as prepared to meet with the board of directors to recommend a new set of financial policies. First, an immediate decision had to be made about whether debt should be reduced by $50 million from available cash. Also, would reliance on the company's retained earnings be sufficient to build up equity, or should another issue of common stock be considered? To elicit interest in its common stock, when funds became available, should the company consider a cash dividend or a stock repurchase? Finally, what capital structure would protect BEAV against a dramatic business downturn triggered by another terrorist attack or by a slowing world economy?
Step by Step Solution
There are 3 Steps involved in it
Step: 1

Get Instant Access to Expert-Tailored Solutions
See step-by-step solutions with expert insights and AI powered tools for academic success
Step: 2

Step: 3
Ace Your Homework with AI
Get the answers you need in no time with our AI-driven, step-by-step assistance
Get Started
Cornerstones of Managerial Accounting
Authors: Mowen, Hansen, Heitger
3rd Edition
324660138, 978-0324660135