Answered step by step
Verified Expert Solution
Question
1 Approved Answer
Bean Town Brothers is a produce processing company that specializes in fruits, with apple sales representing the majority of their revenue. (Click the icon

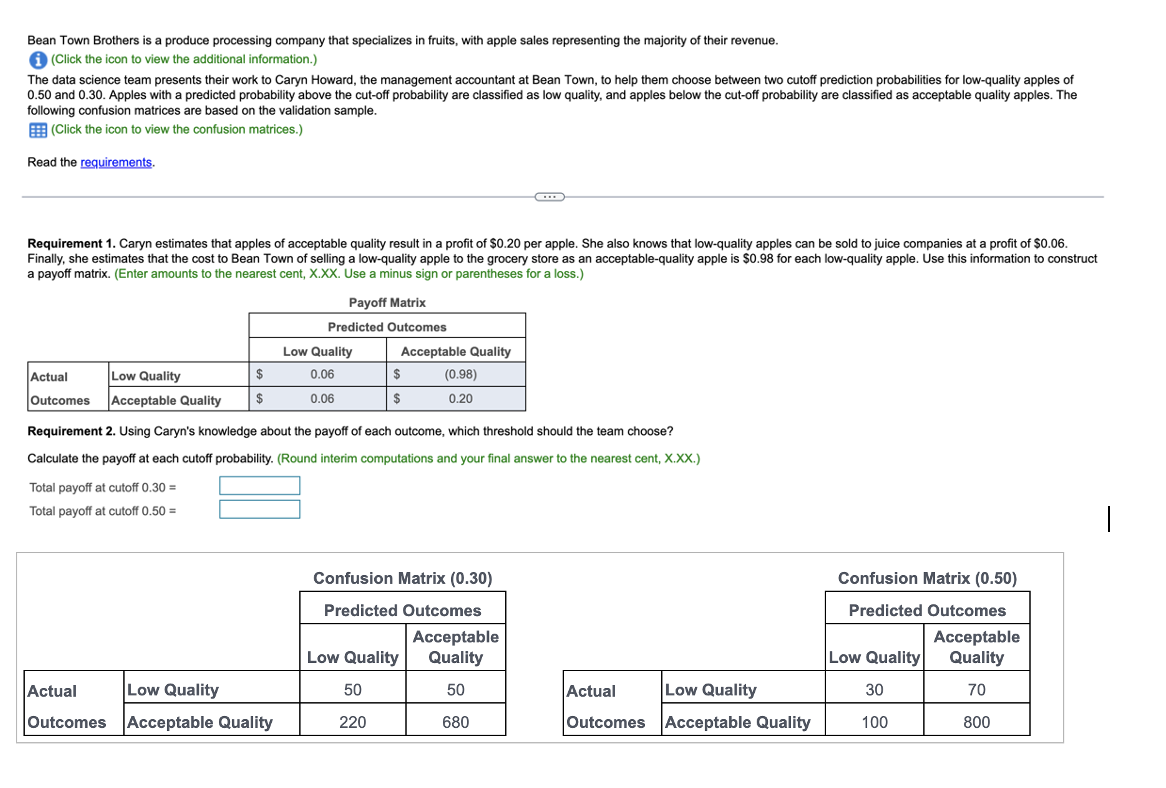
Bean Town Brothers is a produce processing company that specializes in fruits, with apple sales representing the majority of their revenue. (Click the icon to view the additional information.) The data science team presents their work to Caryn Howard, the management accountant at Bean Town, to help them choose between two cutoff prediction probabilities for low-quality apples of 0.50 and 0.30. Apples with a predicted probability above the cut-off probability are classified as low quality, and apples below the cut-off probability are classified as acceptable quality apples. The following confusion matrices are based on the validation sample. (Click the icon to view the confusion matrices.) Read the requirements. Requirement 1. Caryn estimates that apples of acceptable quality result in a profit of $0.20 per apple. She also knows that low-quality apples can be sold to juice companies at a profit of $0.06. Finally, she estimates that the cost to Bean Town of selling a low-quality apple to the grocery store as an acceptable-quality apple is $0.98 for each low-quality apple. Use this information to construct a payoff matrix. (Enter amounts to the nearest cent, X.XX. Use a minus sign or parentheses for a loss.) Payoff Matrix Predicted Outcomes Low Quality Acceptable Quality Actual Low Quality $ 0.06 $ (0.98) Outcomes Acceptable Quality $ 0.06 $ 0.20 Requirement 2. Using Caryn's knowledge about the payoff of each outcome, which threshold should the team choose? Calculate the payoff at each cutoff probability. (Round interim computations and your final answer to the nearest cent, X.XX.) Total payoff at cutoff 0.30= Total payoff at cutoff 0.50 = Confusion Matrix (0.30) Predicted Outcomes Acceptable Confusion Matrix (0.50) Low Quality Quality Predicted Outcomes Acceptable Low Quality Quality Actual Low Quality Outcomes Acceptable Quality 50 50 Actual Low Quality 30 70 220 680 Outcomes Acceptable Quality 100 800
Step by Step Solution
There are 3 Steps involved in it
Step: 1

Get Instant Access to Expert-Tailored Solutions
See step-by-step solutions with expert insights and AI powered tools for academic success
Step: 2

Step: 3

Ace Your Homework with AI
Get the answers you need in no time with our AI-driven, step-by-step assistance
Get Started


