Bear Stearns & Co Answer the following 10 questions, using the financial statement data from Blockbuster Entertainment Corporation. Show your work (i.e., note what numbers you're using).
On May 9, 1989, Bear Stearns & Co. issued a report on Blockbuster Entertainment Corp., which is reproduced in part below. Blockbuster-Entertainment (Ticker symbol: BV, Price per share: $33 12) increased owned and franchised video stores from 19 at the end of 1986 to 415 at December 31, 1988. In the same period revenue jumped from $7.4 million to $136.9 million. Reported earnings also leaped; from $.34 per share in 1986 to $.57 per share in 1988. The stock carries a historical Price to Earnings ratio of 59, and there were 25,741,549 shares of common stock issued and outstanding as of 12/31/88.
3) BV drastically slowed its depreciation (amortization) of "hit* video tapes at the start of 1988. In 1987 BV depreciated its rental videotape "hits" over nine months, straight line. At the start of 1988, it switched to a method it called "36 month accelerated. The financial statements do not disclose how accelerated the curve is, but do say that the company uses 150% of straight line, computed on a monthly basis. Thus, the resulting depreciation is as follows:
First 12 months 40%
Second 12 months 30%
Third 12 months 30%
a) Over what period does BV depreciate its "base stock videotapes?
b) What was the effect on earnings per share of the change in depreciation method for hit tapes (assume that hit tapes made up 25% of new tape purchases, and that the average hit tape was owned for half the year)?
BV also sells videotapes. However, most of the sales are in bulk to new franchisees, rather than to store customers. In 1988, 68% of sales were to franchisees.
c) What was the effect on earnings per share of these sales to franchisees?
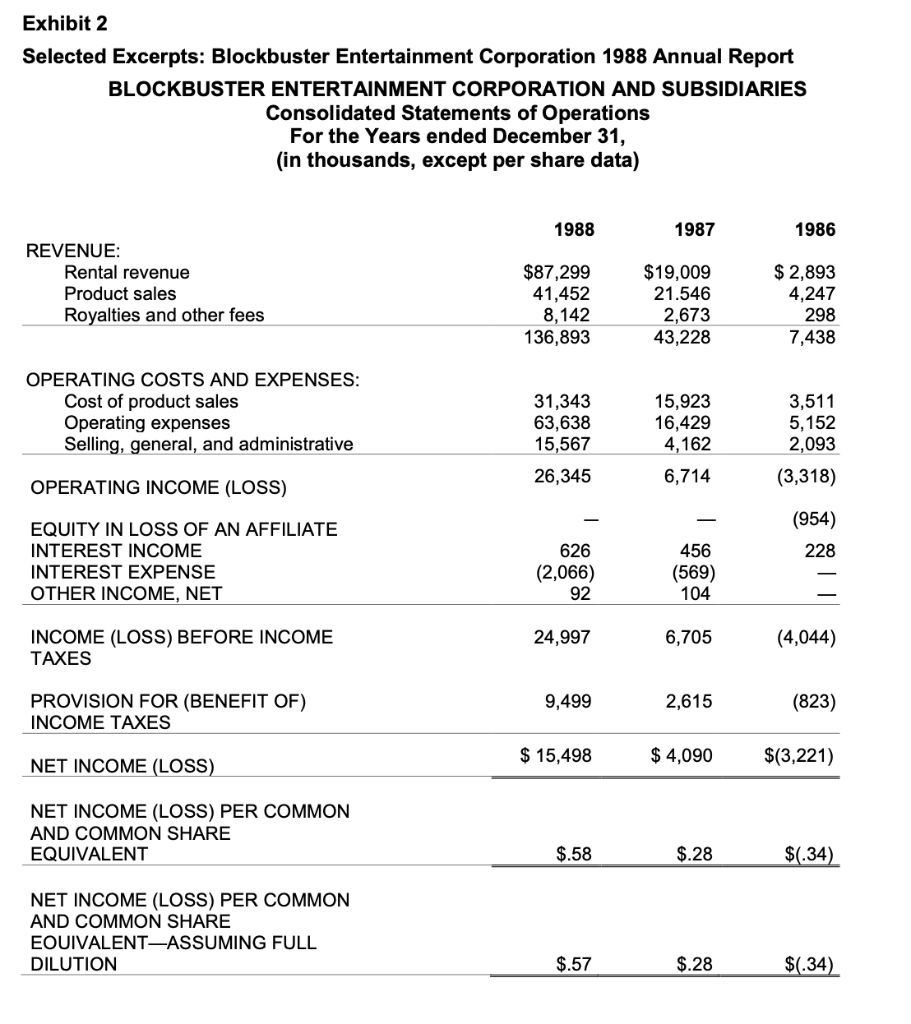
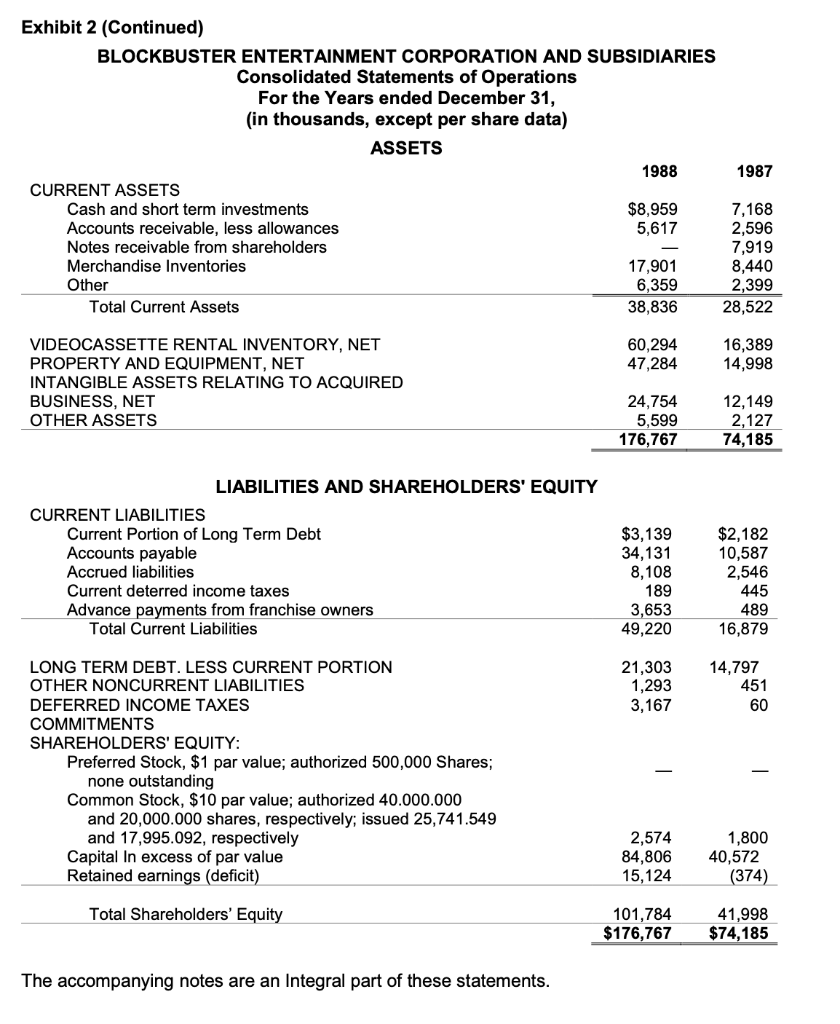
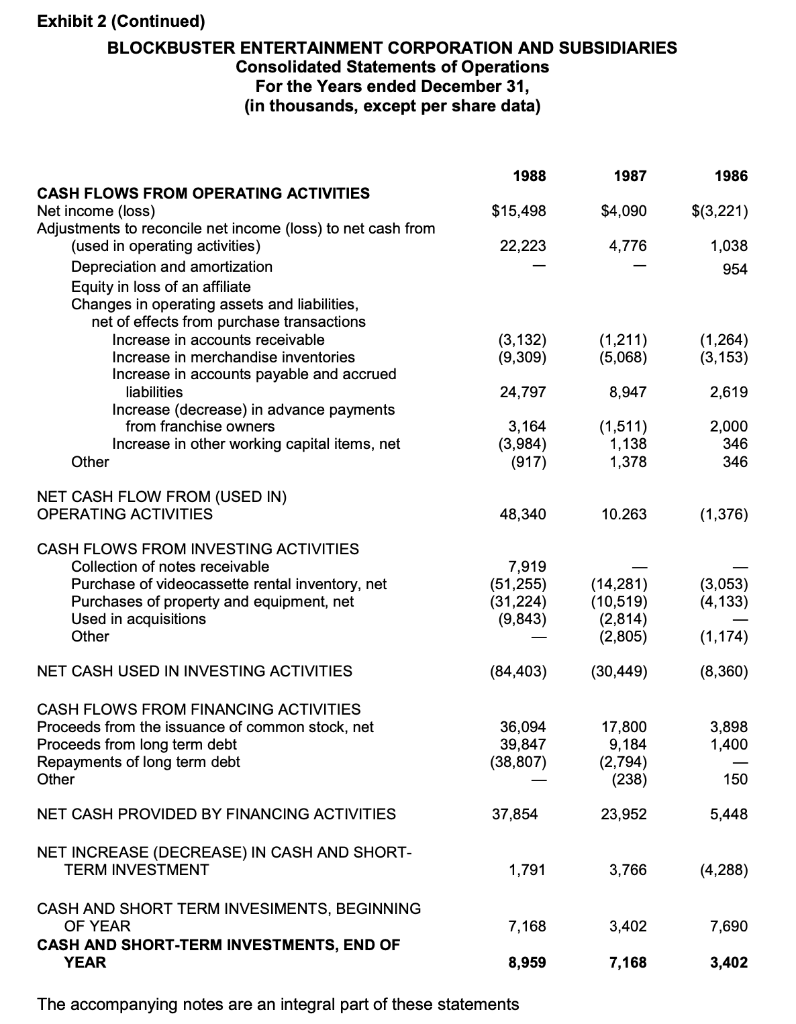
Exhibit 2 Selected Excerpts: Blockbuster Entertainment Corporation 1988 Annual Report BLOCKBUSTER ENTERTAINMENT CORPORATION AND SUBSIDIARIES Consolidated Statements of Operations For the Years ended December 31, (in thousands, except per share data) 1988 1987 1986 REVENUE: Rental revenue Product sales Royalties and other fees $87,299 41,452 8,142 136,893 $19,009 21.546 2,673 43,228 $ 2,893 4,247 298 7,438 OPERATING COSTS AND EXPENSES: Cost of product sales Operating expenses Selling, general, and administrative 31,343 63,638 15,567 26,345 15,923 16,429 4,162 6,714 3,511 5,152 2,093 OPERATING INCOME (LOSS) (3,318) (954) 228 EQUITY IN LOSS OF AN AFFILIATE INTEREST INCOME INTEREST EXPENSE OTHER INCOME, NET 626 (2,066) 92 456 (569) 104 INCOME (LOSS) BEFORE INCOME TAXES 24,997 6,705 (4,044) PROVISION FOR (BENEFIT OF) INCOME TAXES 9,499 2,615 (823) NET INCOME (LOSS) $ 15,498 $ 4,090 $(3,221) NET INCOME (LOSS) PER COMMON AND COMMON SHARE EQUIVALENT $.58 $.28 $0.34) NET INCOME (LOSS) PER COMMON AND COMMON SHARE EQUIVALENT-ASSUMING FULL DILUTION $.57 $.28 $0.34) Exhibit 2 (Continued) BLOCKBUSTER ENTERTAINMENT CORPORATION AND SUBSIDIARIES Consolidated Statements of Operations For the Years ended December 31, (in thousands, except per share data) ASSETS 1988 1987 CURRENT ASSETS Cash and short term investments $8,959 7,168 Accounts receivable, less allowances 5,617 2,596 Notes receivable from shareholders 7,919 Merchandise Inventories 17,901 8,440 Other 6,359 2,399 Total Current Assets 38,836 28,522 60,294 47,284 16,389 14,998 VIDEOCASSETTE RENTAL INVENTORY, NET PROPERTY AND EQUIPMENT, NET INTANGIBLE ASSETS RELATING TO ACQUIRED BUSINESS, NET OTHER ASSETS 24,754 5,599 176,767 12,149 2,127 74,185 LIABILITIES AND SHAREHOLDERS' EQUITY CURRENT LIABILITIES Current Portion of Long Term Debt Accounts payable Accrued liabilities Current deterred income taxes Advance payments from franchise owners Total Current Liabilities $3,139 34,131 8,108 189 3,653 49,220 $2,182 10,587 2,546 445 489 16,879 21,303 1,293 3,167 14,797 451 60 LONG TERM DEBT. LESS CURRENT PORTION OTHER NONCURRENT LIABILITIES DEFERRED INCOME TAXES COMMITMENTS SHAREHOLDERS' EQUITY: Preferred Stock, $1 par value; authorized 500,000 Shares; none outstanding Common Stock, $10 par value; authorized 40.000.000 and 20,000.000 shares, respectively; issued 25,741.549 and 17,995.092, respectively Capital In excess of par value Retained earnings (deficit) 2,574 84,806 15,124 1,800 40,572 (374) Total Shareholders' Equity 101,784 $176,767 41,998 $74,185 The accompanying notes are an Integral part of these statements. Exhibit 2 (Continued) BLOCKBUSTER ENTERTAINMENT CORPORATION AND SUBSIDIARIES Consolidated Statements of Operations For the Years ended December 31, (in thousands, except per share data) 1988 1987 1986 $15,498 $4,090 $(3,221) 22,223 4,776 1,038 954 CASH FLOWS FROM OPERATING ACTIVITIES Net income (loss) Adjustments to reconcile net income (loss) to net cash from (used in operating activities) Depreciation and amortization Equity in loss of an affiliate Changes in operating assets and liabilities, net of effects from purchase transactions Increase in accounts receivable Increase in merchandise inventories Increase in accounts payable and accrued liabilities Increase (decrease) in advance payments from franchise owners Increase in other working capital items, net Other (3,132) (9,309) (1,211) (5,068) (1,264) (3,153) 24,797 8,947 2,619 3,164 (3,984) (917) (1,511) 1,138 1,378 2,000 346 346 NET CASH FLOW FROM (USED IN) OPERATING ACTIVITIES 48,340 10.263 (1,376) CASH FLOWS FROM INVESTING ACTIVITIES Collection of notes receivable Purchase of videocassette rental inventory, net Purchases of property and equipment, net Used in acquisitions Other 7,919 (51,255) (31,224) (9,843) (3,053) (4,133) (14,281) (10,519) (2,814) (2,805) (1,174) NET CASH USED IN INVESTING ACTIVITIES (84,403) (30,449) (8,360) CASH FLOWS FROM FINANCING ACTIVITIES Proceeds from the issuance of common stock, net Proceeds from long term debt Repayments of long term debt Other 36,094 39,847 (38,807) 3,898 1,400 17,800 9,184 (2,794) (238) 150 NET CASH PROVIDED BY FINANCING ACTIVITIES 37,854 23,952 5,448 NET INCREASE (DECREASE) IN CASH AND SHORT- TERM INVESTMENT 1,791 3,766 (4,288) 7,168 3,402 CASH AND SHORT TERM INVESIMENTS, BEGINNING OF YEAR CASH AND SHORT-TERM INVESTMENTS, END OF YEAR 7,690 8,959 7,168 3,402 The accompanying notes are an integral part of these statements Exhibit 2 Selected Excerpts: Blockbuster Entertainment Corporation 1988 Annual Report BLOCKBUSTER ENTERTAINMENT CORPORATION AND SUBSIDIARIES Consolidated Statements of Operations For the Years ended December 31, (in thousands, except per share data) 1988 1987 1986 REVENUE: Rental revenue Product sales Royalties and other fees $87,299 41,452 8,142 136,893 $19,009 21.546 2,673 43,228 $ 2,893 4,247 298 7,438 OPERATING COSTS AND EXPENSES: Cost of product sales Operating expenses Selling, general, and administrative 31,343 63,638 15,567 26,345 15,923 16,429 4,162 6,714 3,511 5,152 2,093 OPERATING INCOME (LOSS) (3,318) (954) 228 EQUITY IN LOSS OF AN AFFILIATE INTEREST INCOME INTEREST EXPENSE OTHER INCOME, NET 626 (2,066) 92 456 (569) 104 INCOME (LOSS) BEFORE INCOME TAXES 24,997 6,705 (4,044) PROVISION FOR (BENEFIT OF) INCOME TAXES 9,499 2,615 (823) NET INCOME (LOSS) $ 15,498 $ 4,090 $(3,221) NET INCOME (LOSS) PER COMMON AND COMMON SHARE EQUIVALENT $.58 $.28 $0.34) NET INCOME (LOSS) PER COMMON AND COMMON SHARE EQUIVALENT-ASSUMING FULL DILUTION $.57 $.28 $0.34) Exhibit 2 (Continued) BLOCKBUSTER ENTERTAINMENT CORPORATION AND SUBSIDIARIES Consolidated Statements of Operations For the Years ended December 31, (in thousands, except per share data) ASSETS 1988 1987 CURRENT ASSETS Cash and short term investments $8,959 7,168 Accounts receivable, less allowances 5,617 2,596 Notes receivable from shareholders 7,919 Merchandise Inventories 17,901 8,440 Other 6,359 2,399 Total Current Assets 38,836 28,522 60,294 47,284 16,389 14,998 VIDEOCASSETTE RENTAL INVENTORY, NET PROPERTY AND EQUIPMENT, NET INTANGIBLE ASSETS RELATING TO ACQUIRED BUSINESS, NET OTHER ASSETS 24,754 5,599 176,767 12,149 2,127 74,185 LIABILITIES AND SHAREHOLDERS' EQUITY CURRENT LIABILITIES Current Portion of Long Term Debt Accounts payable Accrued liabilities Current deterred income taxes Advance payments from franchise owners Total Current Liabilities $3,139 34,131 8,108 189 3,653 49,220 $2,182 10,587 2,546 445 489 16,879 21,303 1,293 3,167 14,797 451 60 LONG TERM DEBT. LESS CURRENT PORTION OTHER NONCURRENT LIABILITIES DEFERRED INCOME TAXES COMMITMENTS SHAREHOLDERS' EQUITY: Preferred Stock, $1 par value; authorized 500,000 Shares; none outstanding Common Stock, $10 par value; authorized 40.000.000 and 20,000.000 shares, respectively; issued 25,741.549 and 17,995.092, respectively Capital In excess of par value Retained earnings (deficit) 2,574 84,806 15,124 1,800 40,572 (374) Total Shareholders' Equity 101,784 $176,767 41,998 $74,185 The accompanying notes are an Integral part of these statements. Exhibit 2 (Continued) BLOCKBUSTER ENTERTAINMENT CORPORATION AND SUBSIDIARIES Consolidated Statements of Operations For the Years ended December 31, (in thousands, except per share data) 1988 1987 1986 $15,498 $4,090 $(3,221) 22,223 4,776 1,038 954 CASH FLOWS FROM OPERATING ACTIVITIES Net income (loss) Adjustments to reconcile net income (loss) to net cash from (used in operating activities) Depreciation and amortization Equity in loss of an affiliate Changes in operating assets and liabilities, net of effects from purchase transactions Increase in accounts receivable Increase in merchandise inventories Increase in accounts payable and accrued liabilities Increase (decrease) in advance payments from franchise owners Increase in other working capital items, net Other (3,132) (9,309) (1,211) (5,068) (1,264) (3,153) 24,797 8,947 2,619 3,164 (3,984) (917) (1,511) 1,138 1,378 2,000 346 346 NET CASH FLOW FROM (USED IN) OPERATING ACTIVITIES 48,340 10.263 (1,376) CASH FLOWS FROM INVESTING ACTIVITIES Collection of notes receivable Purchase of videocassette rental inventory, net Purchases of property and equipment, net Used in acquisitions Other 7,919 (51,255) (31,224) (9,843) (3,053) (4,133) (14,281) (10,519) (2,814) (2,805) (1,174) NET CASH USED IN INVESTING ACTIVITIES (84,403) (30,449) (8,360) CASH FLOWS FROM FINANCING ACTIVITIES Proceeds from the issuance of common stock, net Proceeds from long term debt Repayments of long term debt Other 36,094 39,847 (38,807) 3,898 1,400 17,800 9,184 (2,794) (238) 150 NET CASH PROVIDED BY FINANCING ACTIVITIES 37,854 23,952 5,448 NET INCREASE (DECREASE) IN CASH AND SHORT- TERM INVESTMENT 1,791 3,766 (4,288) 7,168 3,402 CASH AND SHORT TERM INVESIMENTS, BEGINNING OF YEAR CASH AND SHORT-TERM INVESTMENTS, END OF YEAR 7,690 8,959 7,168 3,402 The accompanying notes are an integral part of these statements