Answered step by step
Verified Expert Solution
Question
1 Approved Answer
Because of limited parking, a lot of colleges and universities are now using mass transportation such as buses to help students from one side


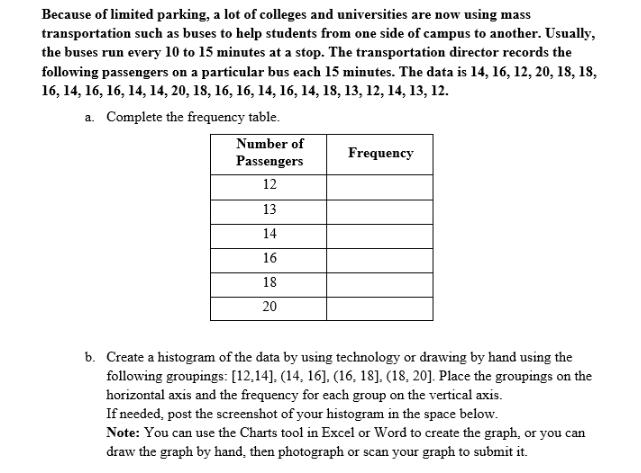
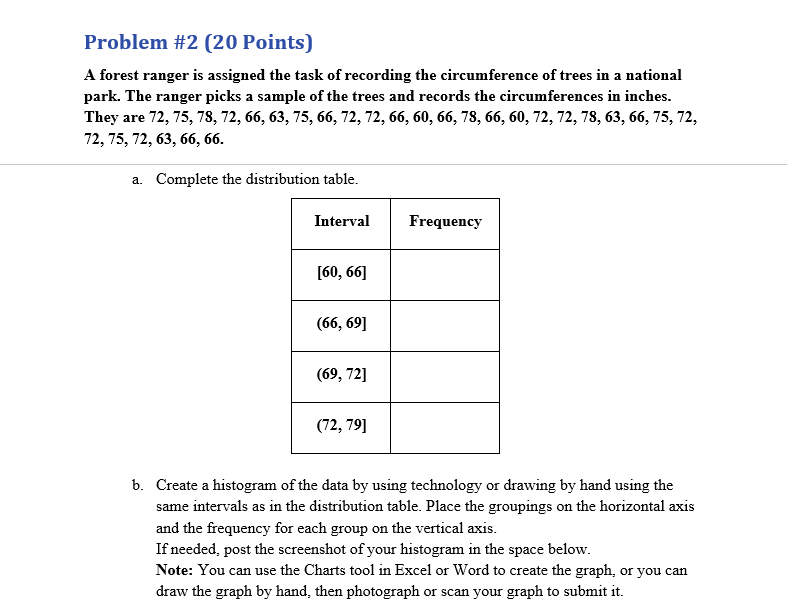
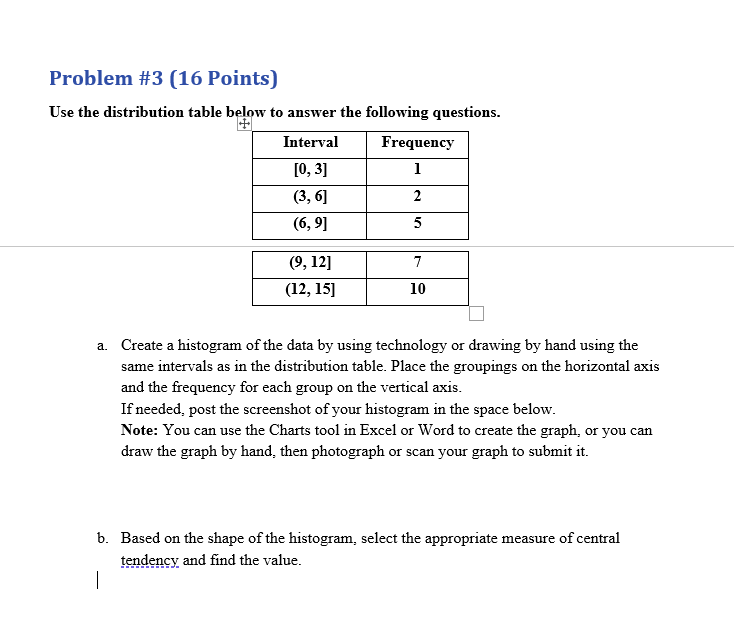
Because of limited parking, a lot of colleges and universities are now using mass transportation such as buses to help students from one side of campus to another. Usually, the buses run every 10 to 15 minutes at a stop. The transportation director records the following passengers on a particular bus each 15 minutes. The data is 14, 16, 12, 20, 18, 18, 16, 14, 16, 16, 14, 14, 20, 18, 16, 16, 14, 16, 14, 18, 13, 12, 14, 13, 12. a. Complete the frequency table. Number of Frequency Passengers 12 13 14 16 18 20 b. Create a histogram of the data by using technology or drawing by hand using the following groupings: [12,14], (14, 16], (16, 18]. (18, 20]. Place the groupings on the horizontal axis and the frequency for each group on the vertical axis. If needed, post the screenshot of your histogram in the space below. Note: You can use the Charts tool in Excel or Word to create the graph, or you can draw the graph by hand, then photograph or scan your graph to submit it. Problem #2 (20 Points) A forest ranger is assigned the task of recording the circumference of trees in a national park. The ranger picks a sample of the trees and records the circumferences in inches. They are 72, 75, 78, 72, 66, 63, 75, 66, 72, 72, 66, 60, 66, 78, 66, 60, 72, 72, 78, 63, 66, 75, 72, 72, 75, 72, 63, 66, 66. a. Complete the distribution table. Interval Frequency [60, 66] (66, 69] (69, 72] (72, 79] b. Create a histogram of the data by using technology or drawing by hand using the same intervals as in the distribution table. Place the groupings on the horizontal axis and the frequency for each group on the vertical axis. If needed, post the screenshot of your histogram in the space below. Note: You can use the Charts tool in Excel or Word to create the graph, or you can draw the graph by hand, then photograph or scan your graph to submit it. Problem #3 (16 Points) Use the distribution table below to answer the following questions. Interval [0,3] Frequency 1 (3,6] 2 (6,9] 5 (9, 12] 7 (12, 15] 10 a. Create a histogram of the data by using technology or drawing by hand using the same intervals as in the distribution table. Place the groupings on the horizontal axis and the frequency for each group on the vertical axis. If needed, post the screenshot of your histogram in the space below. Note: You can use the Charts tool in Excel or Word to create the graph, or you can draw the graph by hand, then photograph or scan your graph to submit it. b. Based on the shape of the histogram, select the appropriate measure of central tendency and find the value.
Step by Step Solution
There are 3 Steps involved in it
Step: 1

Get Instant Access to Expert-Tailored Solutions
See step-by-step solutions with expert insights and AI powered tools for academic success
Step: 2

Step: 3

Ace Your Homework with AI
Get the answers you need in no time with our AI-driven, step-by-step assistance
Get Started


