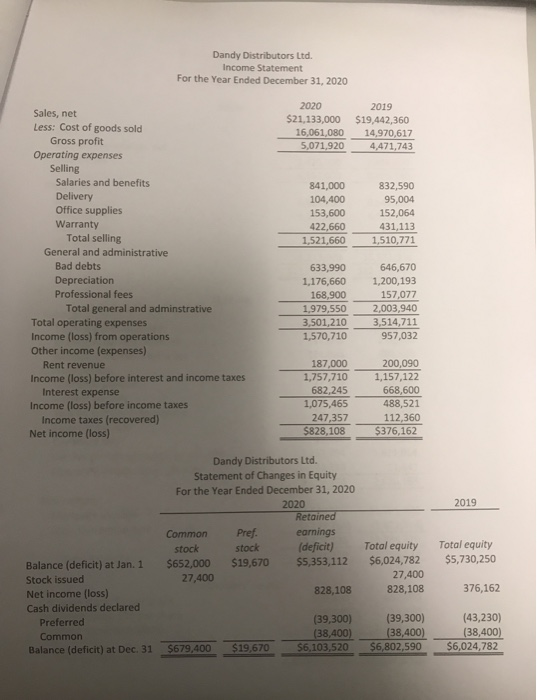
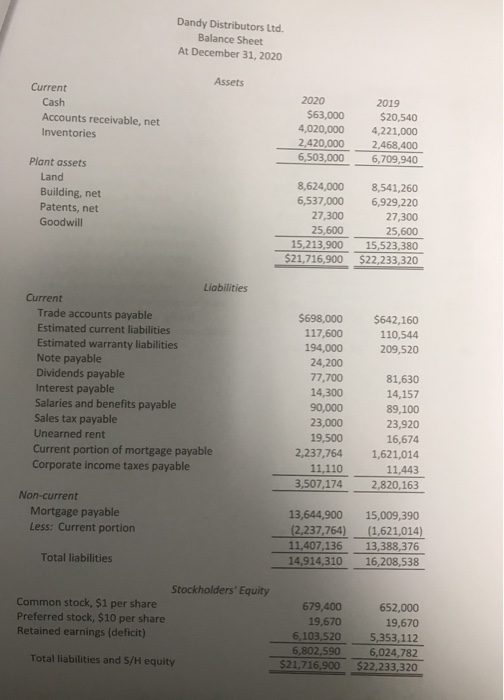
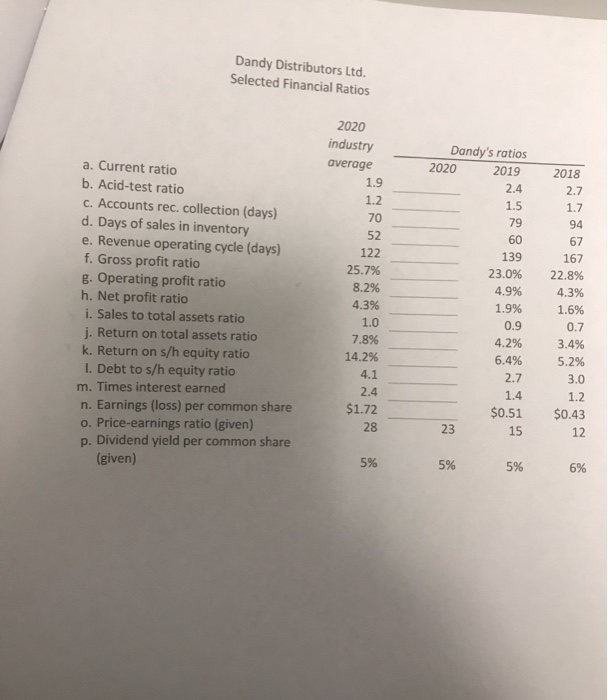
Before you begin, print out all the pages in this workbook. The financial statements of Dandy Distributors Ltd. are shown on the "Fcl. Stmts." page Required: 1 Based on Dandy's financial statements, calculate ratios for the year ended December 31 2020. Assume all sales are on credit. Show your work. 2 From these ratios, analyze the financial performance of Dandy. Dandy Distributors Ltd. Income Statement For the Year Ended December 31, 2020 2020 2019 Sales, net $21,133,000 $19,442,360 14,970,617 Less: Cost of goods sold Gross profit 16,061,080 5,071,920 4,471,743 Operating expenses Selling Salaries and benefits 841,000 832,590 Delivery Office supplies Warranty Total selling 104,400 95,004 153,600 152,064 422,660 431,113 1,510,771 1,521,660 General and administrative Bad debts 646,670 633,990 Depreciation 1,176,660 1,200,193 Professional fees 168.900 157,077 Total general and adminstrative 1,979,550 2,003,940 3,514,711 Total operating expenses Income (loss) from operations Other income (expenses) 3,501,210 1,570,710 957,032 187,000 200,090 Rent revenue 1,757.710 1,157,122 668,600 488,521 Income (loss) before interest and income taxes 682.245 Interest expense 1,075,465 Income (loss) before income taxes 247,357 $828,108 Income taxes (recovered) Net income (loss) 112,360 $376,162 Dandy Distributors Ltd. Statement of Changes in Equity For the Year Ended December 31, 2020 2019 2020 Retained Pref earnings (deficit) $5,353,112 Common Total equity Total equity stock stock $5,730,250 $6,024,782 $19,670 $652,000 Balance (deficit) at Jan. 1 27,400 27,400 Stock issued 828,108 376,162 828,108 Net income (loss) Cash dividends declared (39,300) (38,400) $6,802,590 (43,230) (38,400) $6,024,782 (39,300) (38,400) Preferred Common $6,103,520 $19,670 $679,400 Balance (deficit) at Dec. 31 Dandy Distributors Ltd. Balance Sheet At December 31, 2020 Assets Current 2020 Cash 2019 $63,000 4,020,000 2,420,000 Accounts receivable, net $20,540 4,221,000 Inventories 2,468,400 6,503,000 6,709,940 Plant assets Land 8,624,000 6,537,000 8,541,260 Building, net Patents, net r 6,929,220 27,300 27,300 Goodwill 25,600 25,600 15,213,900 $21,716,900 15,523,380 $22,233,320 Liabilities Current Trade accounts payable $698,000 $642.160 Estimated current liabilities 117,600 110,544 Estimated warranty liabilities Note payable Dividends payable 194,000 24,200 77,700 209,520 81,630 Interest payable Salaries and benefits payable Sales tax payable 14,300 14,157 90,000 23,000 19,500 2,237,764 89,100 23,920 Unearned rent 16,674 Current portion of mortgage payable Corporate income taxes payable 1,621,014 11,110 11,443 2,820,163 3,507,174 Non-current Mortgage payable Less: Current portion 13,644,900 (2,237,764) 15,009,390 (1,621,014) 13,388,376 16,208,538 11,407,136 Total liabilities 14,914,310 Stockholders' Equity Common stock, $1 per share Preferred stock, $10 per share Retained earnings (deficit) 679,400 652,000 19,670 5,353,112 6,024,782 $22,233,320 19,670 6,103,520 6,802.590 Total liabilities and S/H equity $21,716,900 Dandy Distributors Ltd Selected Financial Ratios 2020 industry Dandy's ratios average 2020 2019 2018 a. Current ratio 1.9 2,4 2,7 b. Acid-test ratio 1.2 1.5 1.7 c. Accounts rec. collection (days) d. Days of sales in inventory e. Revenue operating cycle (days) f. Gross profit ratio g.Operating profit ratio h. Net profit ratio i. Sales to total assets ratio 70 79 94 52 60 67 122 139 167 25.7% 23.0% 22.8% 8.2% 4.9% 4.3% 4.3% 1.9% 1.6% 0.7 0.9 1.0 i. Return on total assets ratio 7.8% 4.2% 3.4% k. Return on s/h equity ratio I. Debt to s/h equity ratio 14.2% 6.4% 5.2% 3.0 4.1 2.7 1.2 2.4 1.4 m. Times interest earned $1.72 $0.51 $0.43 n. Earnings (loss) per common share o. Price-earnings ratio (given) p. Dividend yield per common share (given) 12 28 23 15 5% 6% 5% 5%