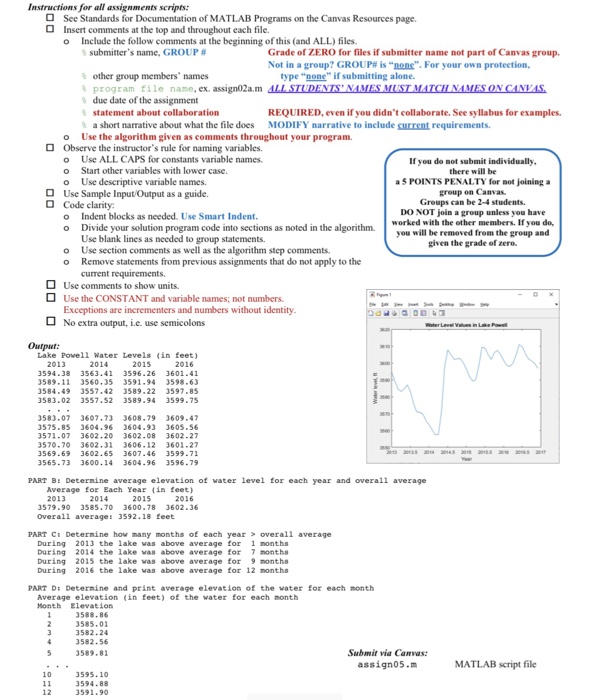
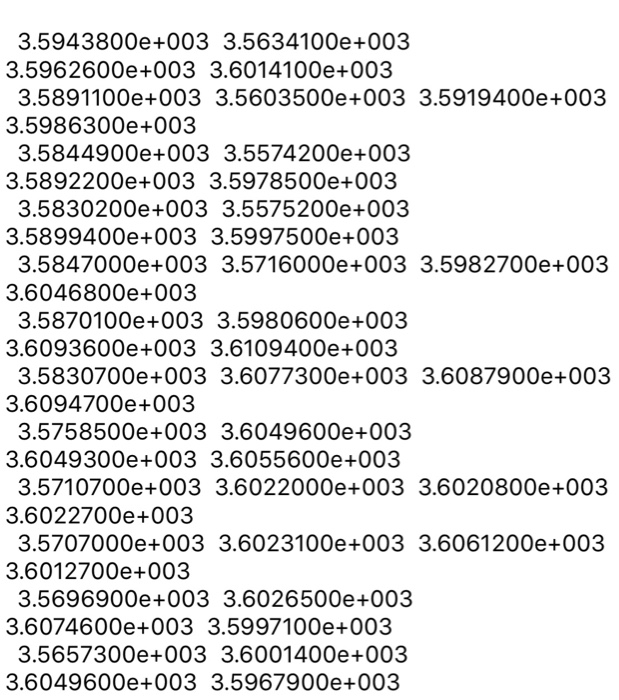
Before you startwriting your program: Download and save a copy of lake_powell.txt in the folder where you will save your assign05.m load () will loolk in the current folder for the data file Problen From MATLAB for Engineers, Se, 2018, H. Moore p312. (4c, 2012 p306 These instractions replace the instructions in the text. The Colorado River Drainage Basin covers parts of seven western states. A series of dams has been constructed on the Colorado River and its tributaries to store runoff water and to generate low-cost hydroelectric power. The ability to regulate the flow of water has made the growth of agriculture and population in these arid desert states possible. Even during periods of extended drought, a steady, reliable source of water and electricity has been available to the basing states. Lake Powell is one of these reservoirs. lake powell.txt contains data on the water level (feet above sea level) in the reservoir for the four years 2013 to 2016 a) Use load) toread lake powell.txt into the lake powe11 matrix. The matrix will have the same name as the file. Print the lake_ powe11 matrix with title and year column headings. Year headings should be printed from a vector of b) Use mean to determine the average elevation of the water level for cach year and the ovcrall average for the four-year period c) Use find and length to determine how many months of each year exceeded the overall average for the four-year period d) Determine and print the average elevation of the water for each month for the four-year period. Use mean. Create a 2-column e) Plot the water level values in lake_powe1l using the following code years. Use a loop to print one month of water levels at a time. over which the data were collected. Print the yearly average vector and the overall average with labels as shown below Print the information as shown below table of the results; print the table. See example 7.2, p.254 date-2013:1/12:2017-1/12; plot (date,lake powell(:)) title( Water Level Values in Lake Powell') xlabel('Year) ylabel( 'Water level, ft') MINUS FIVE POINTS for not having the CORRECT CURRENT GROUP NUMBER in your comments. Problem Constants: (with unit comments) number of months first and last year Problem Inputs: (with units) water levels New commands load) p. 43 Problem Outputs: (with units) see instructions print what each part does as shown below printf p.250-256 Print water level with 2 decimal places Print year, month with 0 decimal places Align numbers under headings Other variables: (with units) as needed Equations: Algorithm: Include the following as comments Use variables for loop control, ie, use number of months constant instead of 12 CONSTANT* % INPUT Use constant names to create vectors of months and years. read data file % print title and year column headings % print contents of lake-powell Followed by comments at the start of each section B through E Helpful examples printf all types ch07 fprintf input Instructions for all assignments scripts: See Standards for Documentation of MATLAB Programs on the Canvas Resources page. Insert comments at the top and throughout each file. o O Include the follow comments at the beginning of this (and ALL) files. submitter's name, GROUP # Grade of ZERO for files if submitter name not part of Canvas group. Not in a group? GROUP# is "none".For your own protection other group members' names program file name, ex-assign2a.m due date of the assignment type "none" if submitting alone. % s REQUIRED, even if you didn't collaborate. See syllabus for examples. a short narrative about what the file does MODIFY narrative to include surrent requirements. o Use the algorithm given as comments throughout your program. Observe the instructor's rule for naming variables. o Use ALL CAPS for constants variable names o Start other variables with lower case. o Use descriptive variable names. If you de not submit individually there will be a 5 POINTS PENALTY for not joining a O Use Sample Input/Output as a guide. O Code clarity on Canvas Groups can be 2-4 students. DO NOT join a group unless you have worked with the other members. If you do, Indent blocks as needed. Use Smart Indent. Divide your solution program code into sections as noted in the algorithm. Use blank lines as needed to group statements. Use section comments as well as the algorithm step comments. Remove statements from previous assignments that do not apply to the current requirements o o you will be removed from the group a given the grade of zero o o Use comments to show units. Use the CONSTANT and variable names; not numbers Exceptions are incrementers and numbers without identity No extra output, i.e. use semicolons Output: Lake Pove11 Water Levels (in feet) 2013 2014 2015 2016 589.11 3560.35 3591.94 3598.63 584.49 3557.42 3589.22 3597.85 3583.02 3557.52 3589.94 3599.75 583.07 3607.73 3608.79 3609.47 575.85 3604.96 3604.93 3605.56 571-07 3602.20 3602.08 3602.27 570-70 3602.31 3606.12 3602.27 3565.73 3600.14 3604.96 3596-79 PART B: Deternine average elevation of vater level for each year and overall average Average for Each Year (in feet 2013 3579.90 3585.70 3600.78 3602.36 Overall average: 3592.18 feet 2014 2015 2016 PART CI Determine how many months of each year overall average During 2013 the lake vas above average for 1 months During 2014 the lake vas above average for 7 months During 2015 the lake vas above average for 9 months During 2016 the lake vas above average for 12 months PART D Determine and print average elevation of the water for each month Average elevation in feet) of the water for each month Month Elevation 588.86 585.01 3582.24 3582.56 589.8 Submit via Canvas: assigno5.m MATLAB script file 10 3595.10 594.88 3591.90 12 3.5962600+003 3.60141 00+003 3.5986300+003 3.5892200+003 3.5978500+003 3.5899400+003 3.5997500+003 3.6046800+003 3.6093600+003 3.6!09400+003 3.6094700+003 3.6049300+003 3.6055600+003 3.6022700+003 3.601 2700+003 3.6074600+003 3.5997|00+003 3.6049600+003 3.5967900+003 3.5943800+003 3.56341 00+003 3.589|100+003 3.5603500+003 3.59|9400+003 3.5844900+003 3.5574200+003 3.5830200+003 3.5575200+003 3.5847000+003 3.57|6000+003 3.5982700+003 3.5870|00+003 3.5980600+003 3.5830700+003 3.6077300+003 3.6087900+003 3.5758500+003 3.6049600+003 3.571 0700+003 3.6022000+003 3.6020800+003 3.5707000+003 3.6023|00+003 3.6061 200+003 3.5696900+003 3.6026500+003 3.5657300+003 3.600|400+003