Answered step by step
Verified Expert Solution
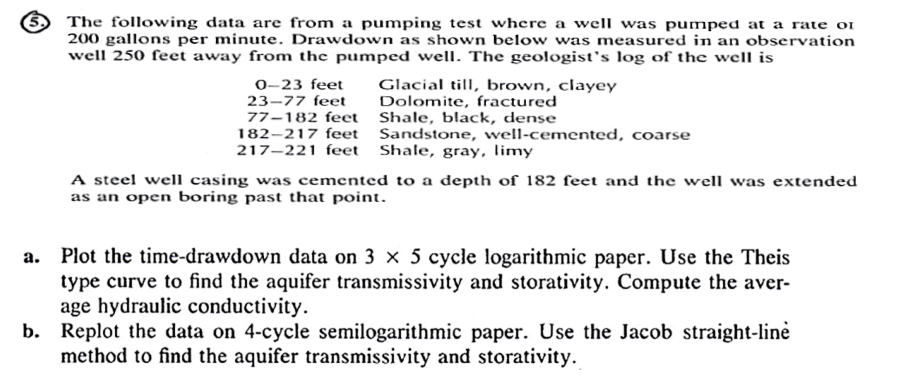
Question
1 Approved Answer
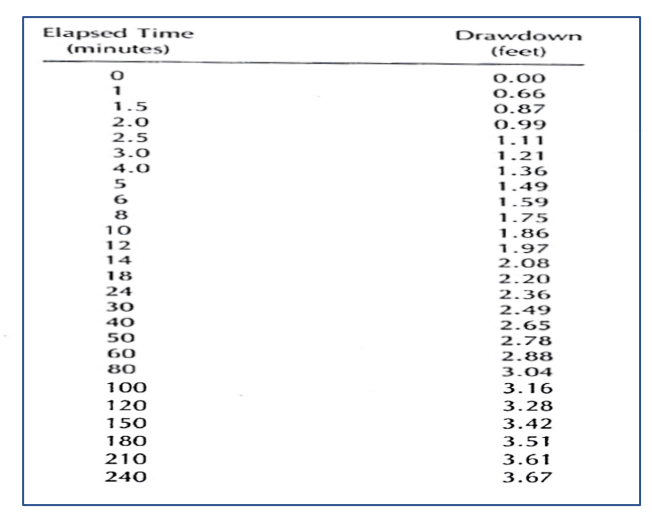
begin{tabular}{cc} ElapsedTime(minutes) & Drawdown(feet) hline 1 & 0.00 1.5 & 0.66 1.5 & 0.87 2.0 & 0.99 2.5 & 1.11
\begin{tabular}{cc} ElapsedTime(minutes) & Drawdown(feet) \\ \hline 1 & 0.00 \\ 1.5 & 0.66 \\ 1.5 & 0.87 \\ 2.0 & 0.99 \\ 2.5 & 1.11 \\ 3.0 & 1.21 \\ 5.0 & 1.36 \\ 6 & 1.49 \\ 8 & 1.59 \\ 10 & 1.75 \\ 12 & 1.86 \\ 14 & 1.97 \\ 18 & 2.08 \\ 24 & 2.20 \\ 30 & 2.36 \\ 40 & 2.49 \\ 50 & 2.65 \\ 60 & 2.88 \\ 80 & 3.04 \\ 100 & 3.16 \\ 120 & 3.28 \\ 150 & 3.42 \\ 180 & 3.51 \\ 210 & 3.61 \\ 240 & 3.67 \end{tabular} (5.) The following data are from a pumping test where a well was pumped at a rate or 200 gallons per minute. Drawdown as shown below was measured in an observation well 250 feet away from the pumped well. The geologist's log of the well is O-23feet2377feet77182feet182217feet217221feetGlacialtill,brown,clayeyDolomite,fracturedShale,black,denseSandstone,well-cemented,coarseShale,gray,limy A steel well casing was cemented to a depth of 182 feet and the well was extended as an open boring past that point. a. Plot the time-drawdown data on 35 cycle logarithmic paper. Use the Theis type curve to find the aquifer transmissivity and storativity. Compute the average hydraulic conductivity. b. Replot the data on 4-cycle semilogarithmic paper. Use the Jacob straight-lin method to find the aquifer transmissivity and storativity
Step by Step Solution
There are 3 Steps involved in it
Step: 1
Get Instant Access to Expert-Tailored Solutions
See step-by-step solutions with expert insights and AI powered tools for academic success
Step: 2
Step: 3
Ace Your Homework with AI
Get the answers you need in no time with our AI-driven, step-by-step assistance
Get Started