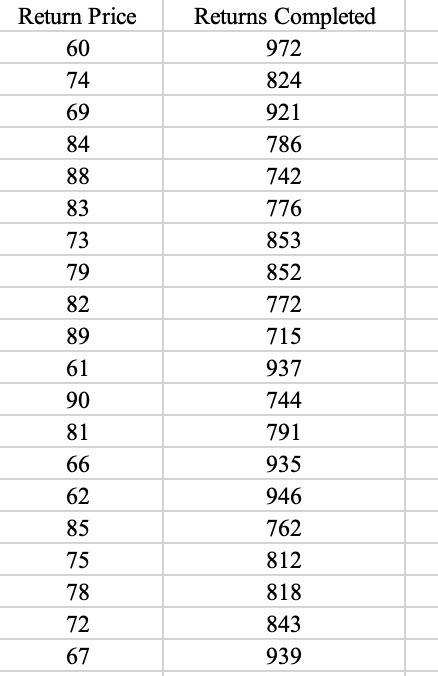
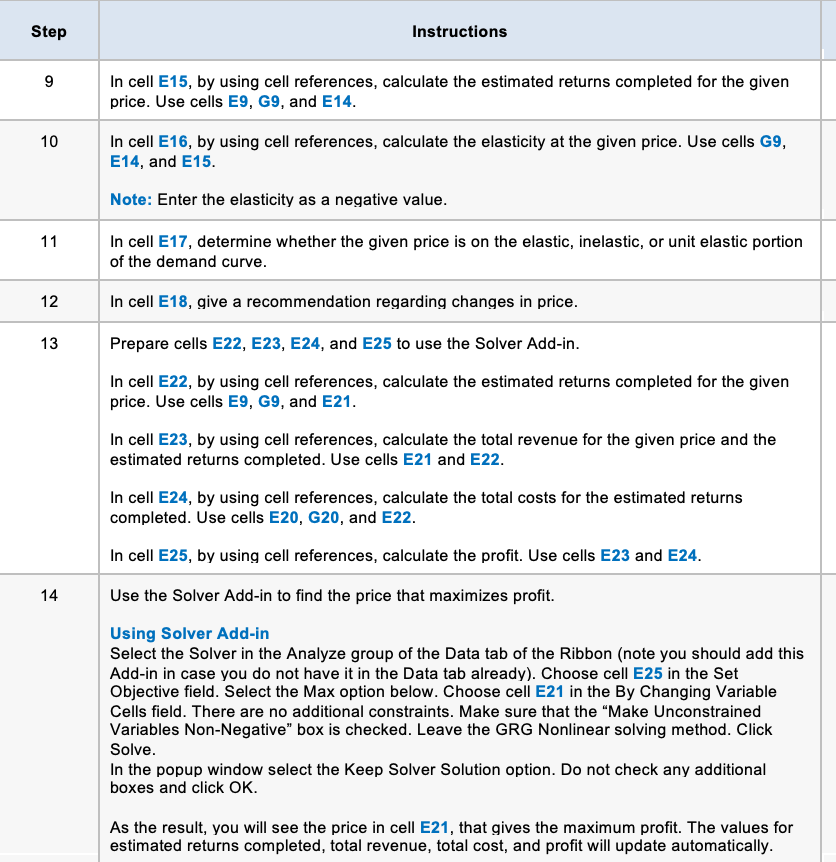
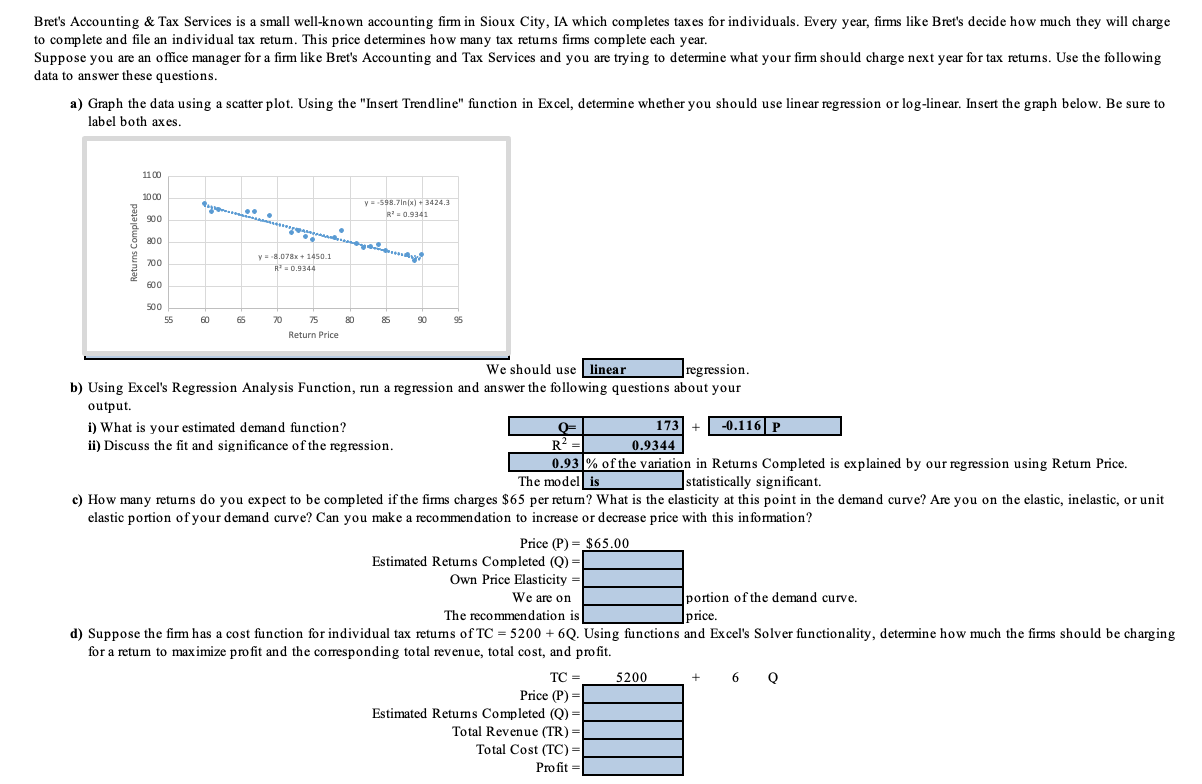
\begin{tabular}{|c|c|} \hline Return Price & Returns Completed \\ \hline 60 & 972 \\ \hline 74 & 824 \\ \hline 69 & 921 \\ \hline 84 & 786 \\ \hline 88 & 742 \\ \hline 83 & 776 \\ \hline 73 & 853 \\ \hline 79 & 852 \\ \hline 82 & 772 \\ \hline 89 & 715 \\ \hline 61 & 937 \\ \hline 90 & 744 \\ \hline 81 & 791 \\ \hline 66 & 935 \\ \hline 62 & 946 \\ \hline 85 & 762 \\ \hline 75 & 812 \\ \hline 78 & 818 \\ \hline 72 & 843 \\ \hline 67 & 939 \\ \hline \end{tabular} Step Instructions As the result, you will see the price in cell E21, that gives the maximum profit. The values for estimated returns completed, total revenue, total cost, and profit will update automatically. Bret's Accounting \& Tax Services is a small well-known accounting firm in Sioux City, IA which completes taxes for individuals. Every year, firms like Bret's decide how much they will charge to complete and file an individual tax retum. This price determines how many tax retums firms complete each year. Suppose you are an office manager for a firm like Bret's Accounting and Tax Services and you are trying to determine what your firm should charge next year for tax retums. Use the following data to answer these questions. a) Graph the data using a scatter plot. Using the "Insert Trendline" function in Excel, determine whether you should use linear regression or log-linear. Insert the graph below. Be sure to label both axes. We should use regression. b) Using Excel's Regression Analysis Function, run a regression and answer the following questions about your output. i) What is your estimated demand function? ii) Discuss the fit and significance of the regression. + n in Retums Completed is explained by our regression using Retum Price. The model statistically significant. c) How many retums do you expect to be completed if the firms charges $65 per retum? What is the elasticity at this point in the demand curve? Are you on the elastic, inelastic, or unit elastic portion of your demand curve? Can you make a recommendation to increase or decrease price with this information? Price (P)=$65.00 Estimated Retums Completed (Q)= Own Price Elasticity =I We are on portion of the demand curve. The recommendation is d) Suppose the firm has a cost function for individual tax retums of TC=5200+6Q. Using functions and Excel's Solver functionality, determine how much the firms should be charging for a retum to maximize profit and the corresponding total revenue, total cost, and profit. \begin{tabular}{|c|c|} \hline Return Price & Returns Completed \\ \hline 60 & 972 \\ \hline 74 & 824 \\ \hline 69 & 921 \\ \hline 84 & 786 \\ \hline 88 & 742 \\ \hline 83 & 776 \\ \hline 73 & 853 \\ \hline 79 & 852 \\ \hline 82 & 772 \\ \hline 89 & 715 \\ \hline 61 & 937 \\ \hline 90 & 744 \\ \hline 81 & 791 \\ \hline 66 & 935 \\ \hline 62 & 946 \\ \hline 85 & 762 \\ \hline 75 & 812 \\ \hline 78 & 818 \\ \hline 72 & 843 \\ \hline 67 & 939 \\ \hline \end{tabular} Step Instructions As the result, you will see the price in cell E21, that gives the maximum profit. The values for estimated returns completed, total revenue, total cost, and profit will update automatically. Bret's Accounting \& Tax Services is a small well-known accounting firm in Sioux City, IA which completes taxes for individuals. Every year, firms like Bret's decide how much they will charge to complete and file an individual tax retum. This price determines how many tax retums firms complete each year. Suppose you are an office manager for a firm like Bret's Accounting and Tax Services and you are trying to determine what your firm should charge next year for tax retums. Use the following data to answer these questions. a) Graph the data using a scatter plot. Using the "Insert Trendline" function in Excel, determine whether you should use linear regression or log-linear. Insert the graph below. Be sure to label both axes. We should use regression. b) Using Excel's Regression Analysis Function, run a regression and answer the following questions about your output. i) What is your estimated demand function? ii) Discuss the fit and significance of the regression. + n in Retums Completed is explained by our regression using Retum Price. The model statistically significant. c) How many retums do you expect to be completed if the firms charges $65 per retum? What is the elasticity at this point in the demand curve? Are you on the elastic, inelastic, or unit elastic portion of your demand curve? Can you make a recommendation to increase or decrease price with this information? Price (P)=$65.00 Estimated Retums Completed (Q)= Own Price Elasticity =I We are on portion of the demand curve. The recommendation is d) Suppose the firm has a cost function for individual tax retums of TC=5200+6Q. Using functions and Excel's Solver functionality, determine how much the firms should be charging for a retum to maximize profit and the corresponding total revenue, total cost, and profit