Answered step by step
Verified Expert Solution
Link Copied!

Question

1 Approved Answer

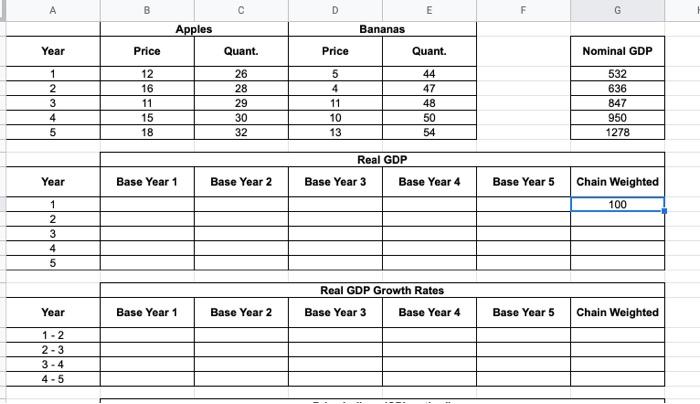
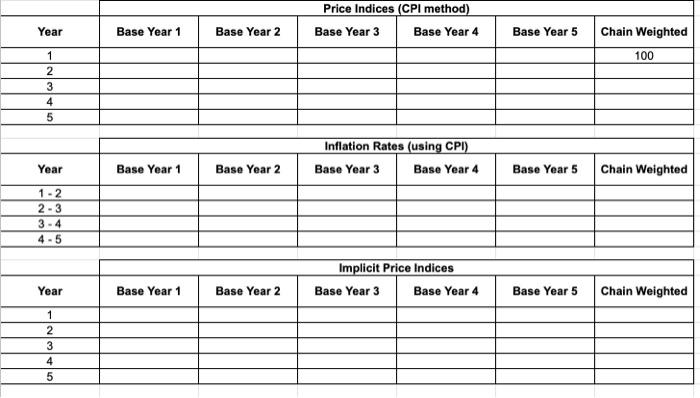
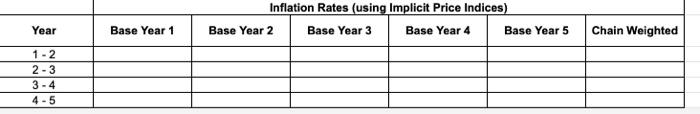
begin{tabular}{|c|c|c|c|c|} hline multicolumn{1}{|c|}{ A } & B & C & E hline Year & multicolumn{2}{|c|}{ Apples } & multicolumn{2}{c|}{ Bananas } hline 1

image text in transcribed
\begin{tabular}{|c|c|c|c|c|} \hline \multicolumn{1}{|c|}{ A } & B & C & E \\ \hline Year & \multicolumn{2}{|c|}{ Apples } & \multicolumn{2}{c|}{ Bananas } \\ \hline 1 & Price & Quant. & Price & Quant. \\ \hline 2 & 12 & 26 & 5 & 44 \\ \hline 3 & 16 & 28 & 4 & 47 \\ \hline 4 & 11 & 29 & 11 & 48 \\ \hline 5 & 15 & 30 & 10 & 50 \\ \hline \end{tabular} \begin{tabular}{|c|} \hline Nominal GDP \\ \hline 532 \\ \hline 636 \\ \hline 847 \\ \hline 950 \\ \hline 1278 \\ \hline \end{tabular} \begin{tabular}{|c|c|c|c|c|c|c|} \cline { 2 - 9 } & \multicolumn{6}{|c|}{ Year } \\ \hline \multirow{2}{*}{ Year } & Base Year 1 & Base Year 2 & Base Year 3 & Base Year 4 & Base Year 5 & Chain Weighted \\ \hline 1 & & & & & & 100 \\ \hline 2 & & & & & & \\ \hline 3 & & & & & & \\ \hline 4 & & & & & & \\ \hline 5 & & & & & & \\ \hline \end{tabular} \begin{tabular}{|c|c|c|c|c|c|c|} \hline \multicolumn{1}{|c|}{} & \multicolumn{6}{|c|}{ Real GDP Growth Rates } \\ \hline Year & Base Year 1 & Base Year 2 & Base Year 3 & Base Year 4 & Base Year 5 & Chain Weighted \\ \hline 12 & & & & & & \\ \hline 23 & & & & & & \\ \hline 34 & & & & & & \\ \hline 45 & & & & & & \\ \hline \end{tabular} \begin{tabular}{|c|c|c|c|c|c|c|} \cline { 2 - 8 } & \multicolumn{6}{|c|}{ Price Indices (CPI method) } \\ \hline Year & Base Year 1 & Base Year 2 & Base Year 3 & Base Year 4 & Base Year 5 & Chain Weighted \\ \hline 1 & & & & & & \\ \hline 2 & & & & & & \\ \hline 3 & & & & & & \\ \hline 4 & & & & & & \\ \hline 5 & & & & & & \\ \hline \end{tabular} \begin{tabular}{|c|c|c|c|c|c|c|} \hline \multicolumn{1}{|c|}{} & \multicolumn{6}{|c|}{ Inflation Rates (using CPI) } \\ \hline Year & Base Year 1 & Base Year 2 & Base Year 3 & Base Year 4 & Base Year 5 & Chain Weighted \\ \hline 12 & & & & & & \\ \hline 23 & & & & & & \\ \hline 34 & & & & & & \\ \hline 45 & & & & & & \\ \hline \end{tabular} \begin{tabular}{|c|c|c|c|c|c|c|} \cline { 2 - 8 } & \multicolumn{6}{|c|}{ Implicit Price Indices } \\ \hline Year & Base Year 1 & Base Year 2 & Base Year 3 & Base Year 4 & Base Year 5 & Chain Weighted \\ \hline 1 & & & & & & \\ \hline 2 & & & & & & \\ \hline 3 & & & & & & \\ \hline 4 & & & & & & \\ \hline 5 & & & & & & \\ \hline \end{tabular} Inflation Rates (ueinn Imnlicit Price Indieas) \begin{tabular}{|c|c|c|c|c|} \hline \multicolumn{1}{|c|}{ A } & B & C & E \\ \hline Year & \multicolumn{2}{|c|}{ Apples } & \multicolumn{2}{c|}{ Bananas } \\ \hline 1 & Price & Quant. & Price & Quant. \\ \hline 2 & 12 & 26 & 5 & 44 \\ \hline 3 & 16 & 28 & 4 & 47 \\ \hline 4 & 11 & 29 & 11 & 48 \\ \hline 5 & 15 & 30 & 10 & 50 \\ \hline \end{tabular} \begin{tabular}{|c|} \hline Nominal GDP \\ \hline 532 \\ \hline 636 \\ \hline 847 \\ \hline 950 \\ \hline 1278 \\ \hline \end{tabular} \begin{tabular}{|c|c|c|c|c|c|c|} \cline { 2 - 9 } & \multicolumn{6}{|c|}{ Year } \\ \hline \multirow{2}{*}{ Year } & Base Year 1 & Base Year 2 & Base Year 3 & Base Year 4 & Base Year 5 & Chain Weighted \\ \hline 1 & & & & & & 100 \\ \hline 2 & & & & & & \\ \hline 3 & & & & & & \\ \hline 4 & & & & & & \\ \hline 5 & & & & & & \\ \hline \end{tabular} \begin{tabular}{|c|c|c|c|c|c|c|} \hline \multicolumn{1}{|c|}{} & \multicolumn{6}{|c|}{ Real GDP Growth Rates } \\ \hline Year & Base Year 1 & Base Year 2 & Base Year 3 & Base Year 4 & Base Year 5 & Chain Weighted \\ \hline 12 & & & & & & \\ \hline 23 & & & & & & \\ \hline 34 & & & & & & \\ \hline 45 & & & & & & \\ \hline \end{tabular} \begin{tabular}{|c|c|c|c|c|c|c|} \cline { 2 - 8 } & \multicolumn{6}{|c|}{ Price Indices (CPI method) } \\ \hline Year & Base Year 1 & Base Year 2 & Base Year 3 & Base Year 4 & Base Year 5 & Chain Weighted \\ \hline 1 & & & & & & \\ \hline 2 & & & & & & \\ \hline 3 & & & & & & \\ \hline 4 & & & & & & \\ \hline 5 & & & & & & \\ \hline \end{tabular} \begin{tabular}{|c|c|c|c|c|c|c|} \hline \multicolumn{1}{|c|}{} & \multicolumn{6}{|c|}{ Inflation Rates (using CPI) } \\ \hline Year & Base Year 1 & Base Year 2 & Base Year 3 & Base Year 4 & Base Year 5 & Chain Weighted \\ \hline 12 & & & & & & \\ \hline 23 & & & & & & \\ \hline 34 & & & & & & \\ \hline 45 & & & & & & \\ \hline \end{tabular} \begin{tabular}{|c|c|c|c|c|c|c|} \cline { 2 - 8 } & \multicolumn{6}{|c|}{ Implicit Price Indices } \\ \hline Year & Base Year 1 & Base Year 2 & Base Year 3 & Base Year 4 & Base Year 5 & Chain Weighted \\ \hline 1 & & & & & & \\ \hline 2 & & & & & & \\ \hline 3 & & & & & & \\ \hline 4 & & & & & & \\ \hline 5 & & & & & & \\ \hline \end{tabular} Inflation Rates (ueinn Imnlicit Price Indieas)

Step by Step Solution

There are 3 Steps involved in it

Step: 1

blur-text-image

Get Instant Access to Expert-Tailored Solutions

See step-by-step solutions with expert insights and AI powered tools for academic success

Step: 2

blur-text-image

Step: 3

blur-text-image

Ace Your Homework with AI

Get the answers you need in no time with our AI-driven, step-by-step assistance

Get Started

Recommended Textbook for

Audit Committee Essentials

Authors: Curtis C. Verschoor

1st Edition

0471699594, 978-0471699590

More Books

Students also viewed these Accounting questions

Question

assess the infl uence of national culture on the workplace

Answered: 1 week ago