

Answered step by step
Verified Expert Solution
Question
1 Approved Answer
begin{tabular}{|c|c|c|c|c|} hline multicolumn{5}{|c|}{ Samsung Electronics Co., Ltd. and Subsidiaries } hline multicolumn{5}{|c|}{ Consolidated Statements of Financial Position } hline multicolumn{5}{|c|}{ (In millions of
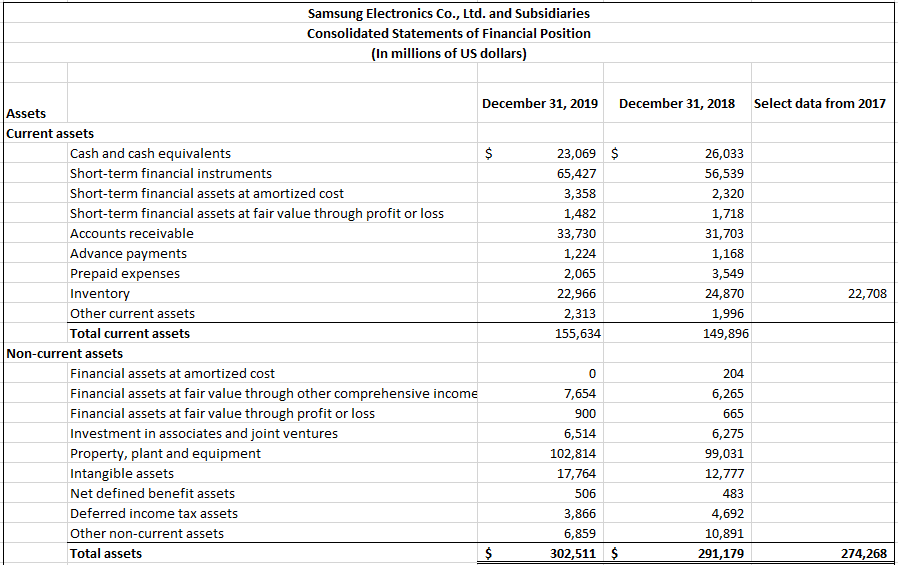

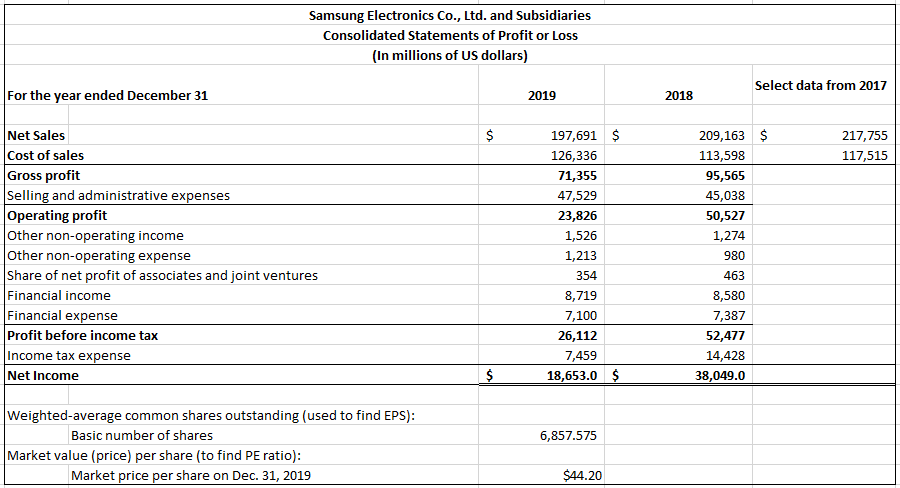
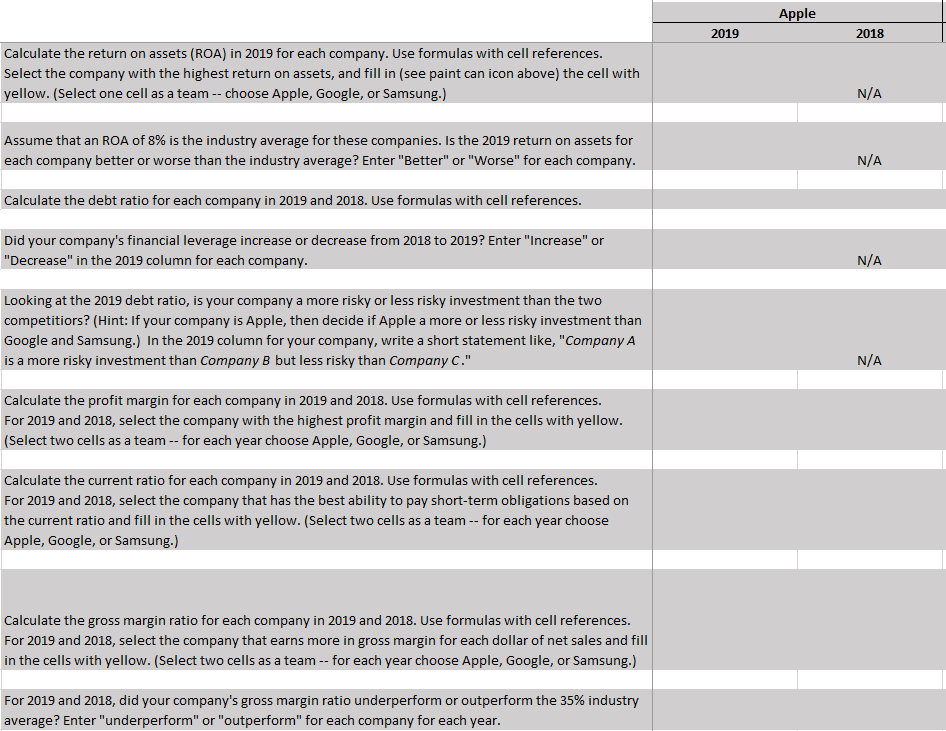
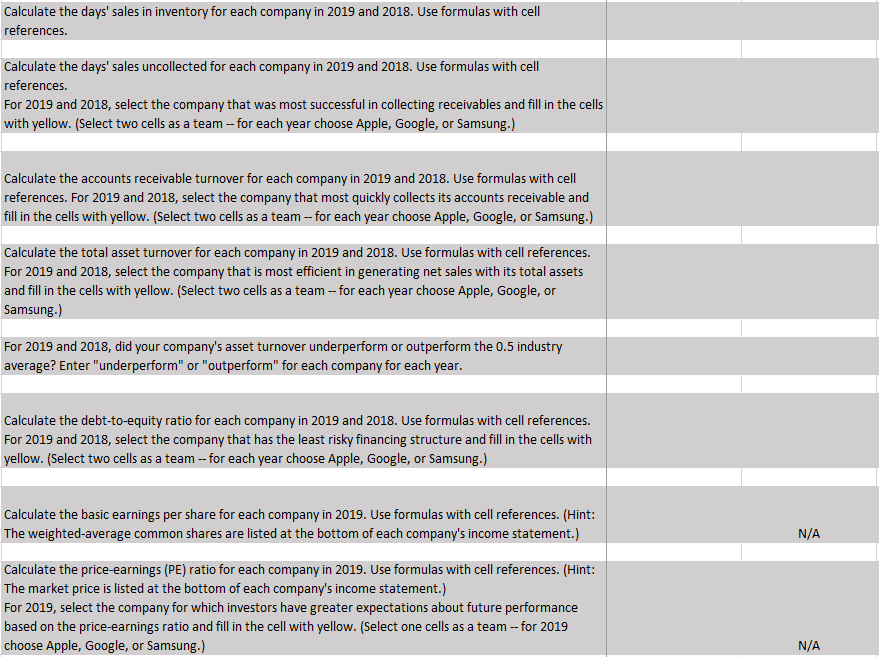 \begin{tabular}{|c|c|c|c|c|} \hline \multicolumn{5}{|c|}{ Samsung Electronics Co., Ltd. and Subsidiaries } \\ \hline \multicolumn{5}{|c|}{ Consolidated Statements of Financial Position } \\ \hline \multicolumn{5}{|c|}{ (In millions of US dollars) } \\ \hline & & & & \\ \hline Assets & & December 31, 2019 & December 31, 2018 & Select data from 2017 \\ \hline \multicolumn{5}{|c|}{ Current assets } \\ \hline & Cash and cash equivalents & 23,069 & 26,033 & \\ \hline & Short-term financial instruments & 65,427 & 56,539 & \\ \hline & Short-term financial assets at amortized cost & 3,358 & 2,320 & \\ \hline & Short-term financial assets at fair value through profit or loss & 1,482 & 1,718 & \\ \hline & Accounts receivable & 33,730 & 31,703 & \\ \hline & Advance payments & 1,224 & 1,168 & \\ \hline & Prepaid expenses & 2,065 & 3,549 & \\ \hline & Inventory & 22,966 & 24,870 & 22,708 \\ \hline & Other current assets & 2,313 & 1,996 & \\ \hline & Total current assets & 155,634 & 149,896 & \\ \hline \multicolumn{5}{|c|}{ Non-current assets } \\ \hline & Financial assets at amortized cost & 0 & 204 & \\ \hline & Financial assets at fair value through other comprehensive income & 7,654 & 6,265 & \\ \hline & Financial assets at fair value through profit or loss & 900 & 665 & \\ \hline & Investment in associates and joint ventures & 6,514 & 6,275 & \\ \hline & Property, plant and equipment & 102,814 & 99,031 & \\ \hline & Intangible assets & 17,764 & 12,777 & \\ \hline & Net defined benefit assets & 506 & 483 & \\ \hline & Deferred income tax assets & 3,866 & 4,692 & \\ \hline & Other non-current assets & 6,859 & 10,891 & \\ \hline & Total assets & 302,511 & 291,179 & 274,268 \\ \hline \end{tabular} \begin{tabular}{|c|c|c|c|} \hline \multicolumn{4}{|l|}{ Liabilities and Equity } \\ \hline \multicolumn{4}{|l|}{ Current liabilities } \\ \hline Trade payables & 7,480 & 7,276 & \\ \hline Short-term borrowings & 12,350 & 11,658 & \\ \hline Other payables & 10,299 & 9,191 & \\ \hline Advances received & 920 & 704 & \\ \hline Withholdings & 770 & 816 & \\ \hline Accrued expenses & 16,611 & 17,452 & \\ \hline Current income tax liabilities & 1,191 & 7,482 & \\ \hline Current portion of long-term liabilities & 726 & 29 & \\ \hline Provisions & 3,491 & 3,761 & \\ \hline Other current liabilities & 890 & 905 & \\ \hline Total current liabilities & 54,728 & 59,274 & \\ \hline \multicolumn{4}{|l|}{ Non-current liabilities } \\ \hline Debentures & 837 & 825 & \\ \hline Long-term borrowings & 1,885 & 73 & \\ \hline Long-term other payables & 1,874 & 2,741 & \\ \hline Net defined benefit liabilities & 404 & 433 & \\ \hline Deferred income tax liabilities & 14,633 & 13,010 & \\ \hline Long-term provisions & 524 & 569 & \\ \hline Other non-current liabilities & 2,067 & 1,674 & \\ \hline Total liabilities & 76,952 & 78,599 & \\ \hline \multicolumn{4}{|l|}{ Equity attributable to owners of the parent company } \\ \hline Preference shares & 102 & 102 & \\ \hline Ordinary shares & 667 & 667 & \\ \hline Share premium & 3,779 & 3,779 & \\ \hline Retained earnings & 218,440 & 208,243 & \\ \hline Other components of equity & (4,263) & (6,805) & \\ \hline & 218,725 & 205,986 & \\ \hline Non-controlling interests & 6,834 & 6,594 & \\ \hline Total shareholders' equity & 225,559 & 212,580 & \\ \hline Total liabilities and equity & 302,511 & 291,179 & 274,268 \\ \hline \end{tabular} \begin{tabular}{|c|c|c|c|c|c|c|} \hline \multicolumn{7}{|c|}{ Samsung Electronics Co., Ltd. and Subsidiaries } \\ \hline \multicolumn{7}{|c|}{ Consolidated Statements of Profit or Loss } \\ \hline \multicolumn{7}{|c|}{ (In millions of US dollars) } \\ \hline \multicolumn{2}{|c|}{ For the year ended December 31} & & 019 & & & Select data from 2017 \\ \hline \multicolumn{2}{|c|}{ Net Sales } & $ & 197,691 & $ & 209,163 & 217,755 \\ \hline \multicolumn{2}{|c|}{ Cost of sales } & & 126,336 & & 113,598 & 117,515 \\ \hline \multicolumn{2}{|c|}{ Gross profit } & & 71,355 & & 95,565 & \\ \hline \multicolumn{2}{|c|}{ Selling and administrative expenses } & & 47,529 & & 45,038 & \\ \hline \multicolumn{2}{|c|}{ Operating profit } & & 23,826 & & 50,527 & \\ \hline \multicolumn{2}{|c|}{ Other non-operating income } & & 1,526 & & 1,274 & \\ \hline \multicolumn{2}{|c|}{ Other non-operating expense } & & 1,213 & & 980 & \\ \hline \multicolumn{2}{|c|}{ Share of net profit of associates and joint ventures } & & 354 & & 463 & \\ \hline \multicolumn{2}{|c|}{ Financial income } & & 8,719 & & 8,580 & \\ \hline \multicolumn{2}{|c|}{ Financial expense } & & 7,100 & & 7,387 & \\ \hline \multicolumn{2}{|c|}{ Profit before income tax } & & 26,112 & & 52,477 & \\ \hline \multicolumn{2}{|c|}{ Income tax expense } & & 7,459 & & 14,428 & \\ \hline \multicolumn{2}{|c|}{ Net Income } & $ & 18,653.0 & $ & 38,049.0 & \\ \hline \multicolumn{7}{|c|}{ Weighted-average common shares outstanding (used to find EPS): } \\ \hline & Basic number of shares & & 6,857.575 & & & \\ \hline \multicolumn{7}{|c|}{ Market value (price) per share (to find PE ratio): } \\ \hline & Market price per share on Dec. 31, 2019 & & $44.20 & & & \\ \hline \end{tabular} Calculate the days' sales in inventory for each company in 2019 and 2018 . Use formulas with cell references. Calculate the days' sales uncollected for each company in 2019 and 2018. Use formulas with cell references. For 2019 and 2018, select the company that was most successful in collecting receivables and fill in the cells with yellow. (Select two cells as a team -- for each year choose Apple, Google, or Samsung.) Calculate the accounts receivable turnover for each company in 2019 and 2018 . Use formulas with cell references. For 2019 and 2018, select the company that most quickly collects its accounts receivable and fill in the cells with yellow. (Select two cells as a team -- for each year choose Apple, Google, or Samsung.) Calculate the total asset turnover for each company in 2019 and 2018. Use formulas with cell references. For 2019 and 2018, select the company that is most efficient in generating net sales with its total assets and fill in the cells with yellow. (Select two cells as a team -- for each year choose Apple, Google, or Samsung.) For 2019 and 2018, did your company's asset turnover underperform or outperform the 0.5 industry average? Enter "underperform" or "outperform" for each company for each year. Calculate the debt-to-equity ratio for each company in 2019 and 2018. Use formulas with cell references. For 2019 and 2018, select the company that has the least risky financing structure and fill in the cells with yellow. (Select two cells as a team -- for each year choose Apple, Google, or Samsung.) Calculate the basic earnings per share for each company in 2019. Use formulas with cell references. (Hint: The weighted-average common shares are listed at the bottom of each company's income statement.) N/A Calculate the price-earnings (PE) ratio for each company in 2019. Use formulas with cell references. (Hint: The market price is listed at the bottom of each company's income statement.) For 2019, select the company for which investors have greater expectations about future performance based on the price-earnings ratio and fill in the cell with yellow. (Select one cells as a team -- for 2019 choose Apple, Google, or Samsung.) \begin{tabular}{|c|c|c|} \hline & \multicolumn{2}{|c|}{ Apple } \\ \hline & 2019 & 2018 \\ \hline \begin{tabular}{l} Calculate the return on assets (ROA) in 2019 for each company. Use formulas with cell references. \\ Select the company with the highest return on assets, and fill in (see paint can icon above) the cell with \\ yellow. (Select one cell as a team -- choose Apple, Google, or Samsung.) \end{tabular} & & N/A \\ \hline \begin{tabular}{l} Assume that an ROA of 8% is the industry average for these companies. Is the 2019 return on assets for \\ each company better or worse than the industry average? Enter "Better" or "Worse" for each company. \end{tabular} & & N/A \\ \hline Calculate the debt ratio for each company in 2019 and 2018. Use formulas with cell references. & & \\ \hline \begin{tabular}{l} Did your company's financial leverage increase or decrease from 2018 to 2019? Enter "Increase" or \\ "Decrease" in the 2019 column for each company. \end{tabular} & & N/A \\ \hline \begin{tabular}{l} Looking at the 2019 debt ratio, is your company a more risky or less risky investment than the two \\ competitiors? (Hint: If your company is Apple, then decide if Apple a more or less risky investment than \\ Google and Samsung.) In the 2019 column for your company, write a short statement like, "Company A \\ is a more risky investment than Company B but less risky than Company C." \end{tabular} & & N/A \\ \hline \begin{tabular}{l} Calculate the profit margin for each company in 2019 and 2018. Use formulas with cell references. \\ For 2019 and 2018, select the company with the highest profit margin and fill in the cells with yellow. \\ (Select two cells as a team -- for each year choose Apple, Google, or Samsung.) \end{tabular} & & \\ \hline \begin{tabular}{l} Calculate the current ratio for each company in 2019 and 2018 . Use formulas with cell references. \\ For 2019 and 2018, select the company that has the best ability to pay short-term obligations based on \\ the current ratio and fill in the cells with yellow. (Select two cells as a team -- for each year choose \\ Apple, Google, or Samsung.) \end{tabular} & & \\ \hline \begin{tabular}{l} Calculate the gross margin ratio for each company in 2019 and 2018. Use formulas with cell references. \\ For 2019 and 2018, select the company that earns more in gross margin for each dollar of net sales and fill \\ in the cells with yellow. (Select two cells as a team -- for each year choose Apple, Google, or Samsung.) \end{tabular} & & \\ \hline \begin{tabular}{l} For 2019 and 2018, did your company's gross margin ratio underperform or outperform the 35% industry \\ average? Enter "underperform" or "outperform" for each company for each year. \end{tabular} & & \\ \hline \end{tabular}
 Step by Step Solution
There are 3 Steps involved in it
Step: 1

Get Instant Access to Expert-Tailored Solutions
See step-by-step solutions with expert insights and AI powered tools for academic success
Step: 2

Step: 3
Ace Your Homework with AI
Get the answers you need in no time with our AI-driven, step-by-step assistance
Get Started
Financial Accounting An Introduction
Authors: Pauline Weetman
4th Edition
0273703404, 978-0273703402