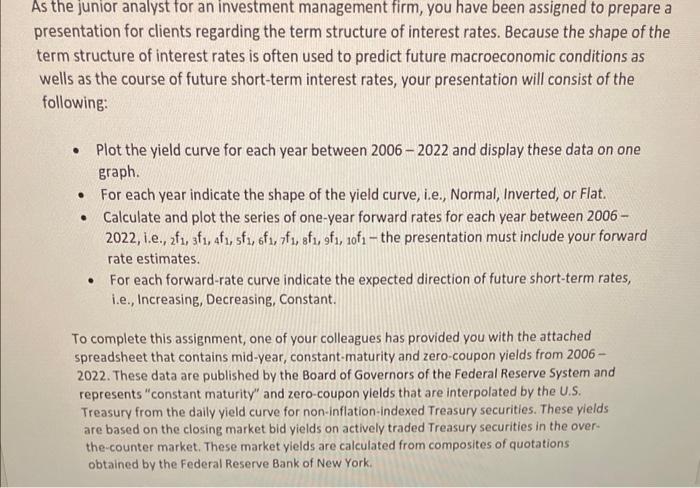
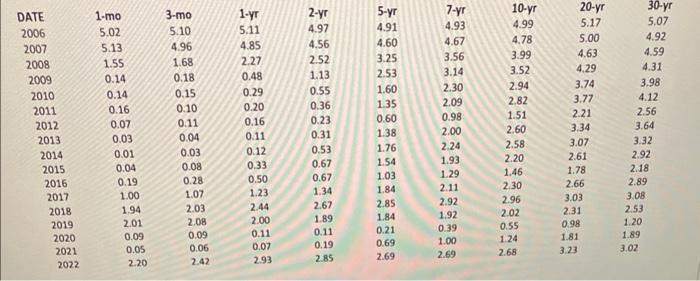
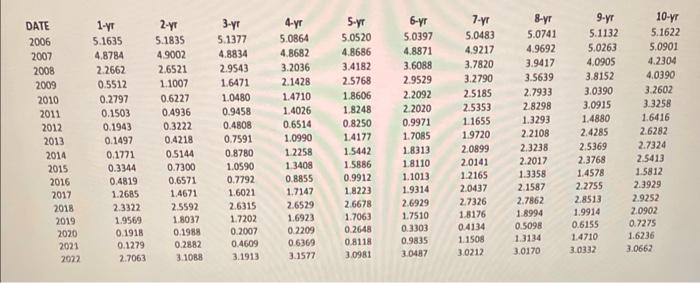
\begin{tabular}{ccc|c|c|c|cccc} DATE & 1mo & 3mo & 1yr & 2yr & 5yr & 7yr & 10yr & 20yr & 30yr \\ 2006 & 5.02 & 5.10 & 5.11 & 4.97 & 4.91 & 4.93 & 4.99 & 5.17 & 5.07 \\ 2007 & 5.13 & 4.96 & 4.85 & 4.56 & 4.60 & 4.67 & 4.78 & 5.00 & 4.92 \\ 2008 & 1.55 & 1.68 & 2.27 & 2.52 & 3.25 & 3.56 & 3.99 & 4.63 & 4.59 \\ 2009 & 0.14 & 0.18 & 0.48 & 1.13 & 2.53 & 3.14 & 3.52 & 4.29 & 4.31 \\ 2010 & 0.14 & 0.15 & 0.29 & 0.55 & 1.60 & 2.30 & 2.94 & 3.74 & 3.98 \\ 2011 & 0.16 & 0.10 & 0.20 & 0.36 & 1.35 & 2.09 & 2.82 & 3.77 & 4.12 \\ 2012 & 0.07 & 0.11 & 0.16 & 0.23 & 0.60 & 0.98 & 1.51 & 2.21 & 2.56 \\ 2013 & 0.03 & 0.04 & 0.11 & 0.31 & 1.38 & 2.00 & 2.60 & 3.34 & 3.64 \\ 2014 & 0.01 & 0.03 & 0.12 & 0.53 & 1.76 & 2.24 & 2.58 & 3.07 & 3.32 \\ 2015 & 0.04 & 0.08 & 0.33 & 0.67 & 1.54 & 1.93 & 2.20 & 2.61 & 2.92 \\ 2016 & 0.19 & 0.28 & 0.50 & 0.67 & 1.03 & 1.29 & 1.46 & 1.78 & 2.18 \\ 2017 & 1.00 & 1.07 & 1.23 & 1.34 & 1.84 & 2.11 & 2.30 & 2.66 & 2.89 \\ 2018 & 1.94 & 2.03 & 2.44 & 2.67 & 2.85 & 2.92 & 2.96 & 3.03 & 3.08 \\ 2019 & 2.01 & 2.08 & 2.00 & 1.89 & 1.84 & 1.92 & 2.02 & 2.31 & 2.53 \\ 2020 & 0.09 & 0.09 & 0.11 & 0.11 & 0.21 & 0.39 & 0.55 & 0.98 & 1.20 \\ 2021 & 0.05 & 0.06 & 0.07 & 0.19 & 0.69 & 1.00 & 1.24 & 1.81 & 1.89 \\ 2022 & 2.20 & 2.42 & 2.93 & 2.85 & 2.69 & 2.69 & 2.68 & 3.23 & 3.02 \end{tabular} resentation for clients regarding the term structure of interest rates. Because the shape of the cerm structure of interest rates is often used to predict future macroeconomic conditions as wells as the course of future short-term interest rates, your presentation will consist of the following: - Plot the yield curve for each year between 2006-2022 and display these data on one graph. - For each year indicate the shape of the yield curve, i.e., Normal, Inverted, or Flat. - Calculate and plot the series of one-year forward rates for each year between 2006 2022, i.e., 2f1,3f1,4f1,5f1,6f1,7f1,8f1,9f1,10f1 - the presentation must include your forward rate estimates. - For each forward-rate curve indicate the expected direction of future short-term rates, i.e., Increasing, Decreasing, Constant. To complete this assignment, one of your colleagues has provided you with the attached spreadsheet that contains mid-year, constant-maturity and zero-coupon yields from 2006 2022. These data are published by the Board of Governors of the Federal Reserve System and represents "constant maturity" and zero-coupon yields that are interpolated by the U.S. Treasury from the daily yield curve for non-inflation-indexed Treasury securities. These yields are based on the closing market bid yields on actively traded Treasury securities in the overthe-counter market. These market yields are calculated from composites of quotations obtained by the Federal Reserve Bank of New York. \begin{tabular}{ccc|c|c|c|cccc} DATE & 1mo & 3mo & 1yr & 2yr & 5yr & 7yr & 10yr & 20yr & 30yr \\ 2006 & 5.02 & 5.10 & 5.11 & 4.97 & 4.91 & 4.93 & 4.99 & 5.17 & 5.07 \\ 2007 & 5.13 & 4.96 & 4.85 & 4.56 & 4.60 & 4.67 & 4.78 & 5.00 & 4.92 \\ 2008 & 1.55 & 1.68 & 2.27 & 2.52 & 3.25 & 3.56 & 3.99 & 4.63 & 4.59 \\ 2009 & 0.14 & 0.18 & 0.48 & 1.13 & 2.53 & 3.14 & 3.52 & 4.29 & 4.31 \\ 2010 & 0.14 & 0.15 & 0.29 & 0.55 & 1.60 & 2.30 & 2.94 & 3.74 & 3.98 \\ 2011 & 0.16 & 0.10 & 0.20 & 0.36 & 1.35 & 2.09 & 2.82 & 3.77 & 4.12 \\ 2012 & 0.07 & 0.11 & 0.16 & 0.23 & 0.60 & 0.98 & 1.51 & 2.21 & 2.56 \\ 2013 & 0.03 & 0.04 & 0.11 & 0.31 & 1.38 & 2.00 & 2.60 & 3.34 & 3.64 \\ 2014 & 0.01 & 0.03 & 0.12 & 0.53 & 1.76 & 2.24 & 2.58 & 3.07 & 3.32 \\ 2015 & 0.04 & 0.08 & 0.33 & 0.67 & 1.54 & 1.93 & 2.20 & 2.61 & 2.92 \\ 2016 & 0.19 & 0.28 & 0.50 & 0.67 & 1.03 & 1.29 & 1.46 & 1.78 & 2.18 \\ 2017 & 1.00 & 1.07 & 1.23 & 1.34 & 1.84 & 2.11 & 2.30 & 2.66 & 2.89 \\ 2018 & 1.94 & 2.03 & 2.44 & 2.67 & 2.85 & 2.92 & 2.96 & 3.03 & 3.08 \\ 2019 & 2.01 & 2.08 & 2.00 & 1.89 & 1.84 & 1.92 & 2.02 & 2.31 & 2.53 \\ 2020 & 0.09 & 0.09 & 0.11 & 0.11 & 0.21 & 0.39 & 0.55 & 0.98 & 1.20 \\ 2021 & 0.05 & 0.06 & 0.07 & 0.19 & 0.69 & 1.00 & 1.24 & 1.81 & 1.89 \\ 2022 & 2.20 & 2.42 & 2.93 & 2.85 & 2.69 & 2.69 & 2.68 & 3.23 & 3.02 \end{tabular} resentation for clients regarding the term structure of interest rates. Because the shape of the cerm structure of interest rates is often used to predict future macroeconomic conditions as wells as the course of future short-term interest rates, your presentation will consist of the following: - Plot the yield curve for each year between 2006-2022 and display these data on one graph. - For each year indicate the shape of the yield curve, i.e., Normal, Inverted, or Flat. - Calculate and plot the series of one-year forward rates for each year between 2006 2022, i.e., 2f1,3f1,4f1,5f1,6f1,7f1,8f1,9f1,10f1 - the presentation must include your forward rate estimates. - For each forward-rate curve indicate the expected direction of future short-term rates, i.e., Increasing, Decreasing, Constant. To complete this assignment, one of your colleagues has provided you with the attached spreadsheet that contains mid-year, constant-maturity and zero-coupon yields from 2006 2022. These data are published by the Board of Governors of the Federal Reserve System and represents "constant maturity" and zero-coupon yields that are interpolated by the U.S. Treasury from the daily yield curve for non-inflation-indexed Treasury securities. These yields are based on the closing market bid yields on actively traded Treasury securities in the overthe-counter market. These market yields are calculated from composites of quotations obtained by the Federal Reserve Bank of New York