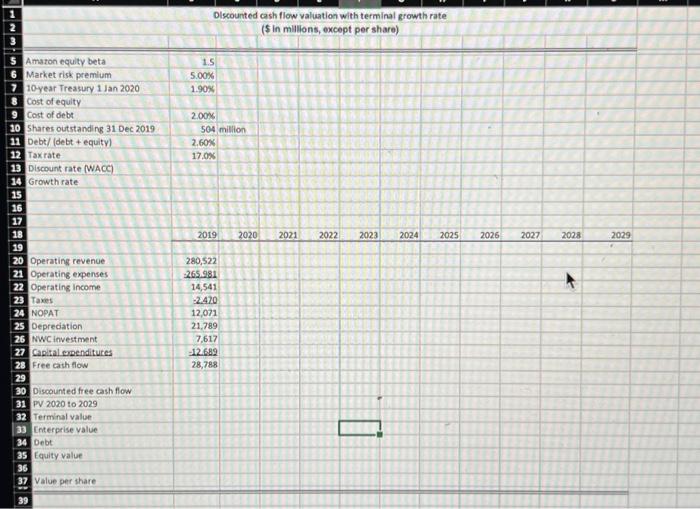
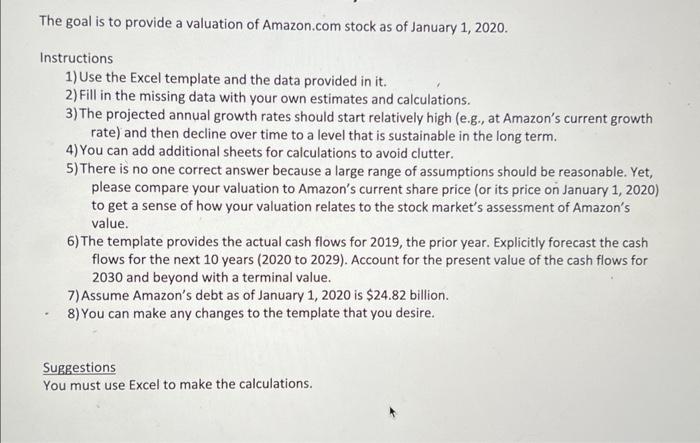
\begin{tabular}{|c|c|c|c|c|c|c|c|c|c|c|c|c|} \hline \multicolumn{13}{|c|}{ Olscounted cash flow valuation with terminal growth rate } \\ \hline 2 & & & & (5in milli & as, exce & persh & & & & & & 2 \\ \hline 3 & & & & & & & & & 18 & & & \\ \hline 5 & Amszon equity beta & 1.5 & & & & & & & & & & \\ \hline 6 & Market risk premlum & 5.00% & & & & & & & 1021 & 17 & & \\ \hline 7 & 10-year Treasury 1 Ian 2020 & 1.900 & & & & & & & & & & \\ \hline 8 & Cost of equity & & & & & & & & & & & \\ \hline 9 & Cost of debt & 2.006 & & & & & & & & & & i \\ \hline 10 & Shares outstanding 31 Dec 2019 & 504 & million & & & & & & & & & \\ \hline 11 & Debt/ (debt + equity) & 2.60% & & & & & & & & & & \\ \hline 12 & Taxrate & 17.085 & & & & & & & & & & \\ \hline 13 & Discount rate (WACC) & & & & & & & & & 87 & & \\ \hline 14 & Growth rate & & & & & & & & & -1 & & \\ \hline 15 & & 7 & & & & & & & & - & & \\ \hline 16 & & & & & & & & & & & & \\ \hline 17 & & 3 & & & & & & & & & & \\ \hline 18 & & 2019 & 2020 & 2021 & 2022 & 2023 & 2024 & 2025 & 2026 & 2027 & 2028 & 2029 \\ \hline 19 & & & & & & & E & & & & & % \\ \hline 20 & Operating revenue & 280,522 & & & & & & & +1 & & - & 8 \\ \hline 21 & Operating expenses & -265.981 & & & & & 4 & & & & 1 & \\ \hline 22 & Operating income & 14,541 & & & & & II & & E & & T & \\ \hline 23 & Taxes & -2.470 & & & & & 11 & & 4 & & E & \\ \hline 24 & & 12,071 & & & & & (1) & & E & & E- & E \\ \hline 25 & Depreciation & 21,789 & & & & & & & & & & \\ \hline 26 & NWC investment & 7,617 & & & & & 7 & & & & 18 & \\ \hline 27 & Capital emenditures & -12.689 & & & & & & & & & & \\ \hline 28 & Free cash flow & 28,788 & & & 4 & & a & - & & & & E \\ \hline 29 & & & & & if & H & 17 & & & & Eas & \\ \hline 30 & Discounted free cash flow & & & & 1 & & & & & +1 & 2= & \\ \hline 31 & PV 2020 to 2029 & & & & 31 & & & 3 & & & & \\ \hline 32 & Terminal value & & & & & 7 & F & 7 & & E & & \\ \hline 33 & Enterprise value & 37 & & & & & & & & Z & 20 & \\ \hline 34 & Debt & & & & & & & Es & 4 & E & 28 & \\ \hline 35 & Equity value & 21 & 7 & & & 7 & 87 & EI & Ex & In & & \\ \hline 36 & & & & & & & & & & & & 4 \\ \hline 37 & Value per share & 12 & & & & & & & & & & \\ \hline 39 & 1 & 1 & & & & & & & +2 & & & \\ \hline \end{tabular} The goal is to provide a valuation of Amazon.com stock as of January 1,2020. Instructions 1) Use the Excel template and the data provided in it. 2) Fill in the missing data with your own estimates and calculations. 3) The projected annual growth rates should start relatively high (e.g., at Amazon's current growth rate) and then decline over time to a level that is sustainable in the long term. 4) You can add additional sheets for calculations to avoid clutter. 5) There is no one correct answer because a large range of assumptions should be reasonable. Yet, please compare your valuation to Amazon's current share price (or its price on January 1, 2020) to get a sense of how your valuation relates to the stock market's assessment of Amazon's value. 6) The template provides the actual cash flows for 2019 , the prior year. Explicitly forecast the cash flows for the next 10 years (2020 to 2029). Account for the present value of the cash flows for 2030 and beyond with a terminal value. 7) Assume Amazon's debt as of January 1,2020 is $24.82 billion. 8) You can make any changes to the template that you desire