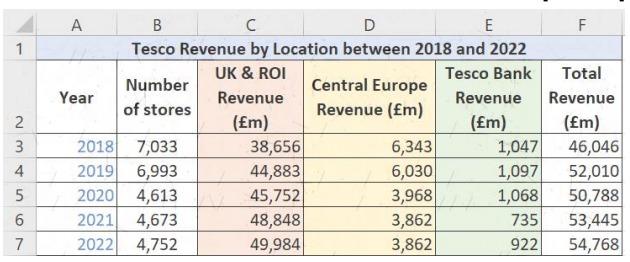
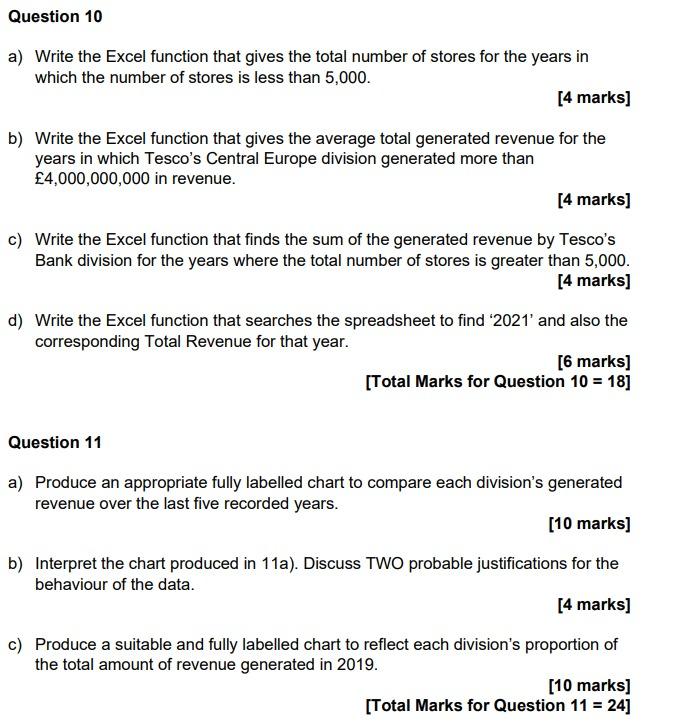
\begin{tabular}{|l|c|c|c|r|r|r|} \hline & A & \multicolumn{1}{c}{ B } & \multicolumn{1}{c}{ C } & \multicolumn{1}{c}{ D } & \multicolumn{1}{c|}{ E } & \multicolumn{1}{c|}{F} \\ \hline 1 & \multicolumn{5}{|c|}{ Tesco Revenue by Location between 2018 and 2022 } & \\ \hline & Year & Number of stores & UK \& ROI Revenue (fm) & Central Europe Revenue (fm) & Tesco Bank Revenue (fm) & Total Revenue (fm) \\ \hline & & 38,656 & 6,343 & 1,047 & 46,046 \\ \hline 3 & 2018 & 7,033 & 44,883 & 6,030 & 1,097 & 52,010 \\ \hline 4 & 2019 & 6,993 & 45,752 & 3,968 & 1,068 & 50,788 \\ \hline 5 & 2020 & 4,613 & 48,848 & 3,862 & 735 & 53,445 \\ \hline 6 & 2021 & 4,673 & 49,984 & 3,862 & 922 & 54,768 \\ \hline & 2022 & 4,752 & & \end{tabular} Question 10 a) Write the Excel function that gives the total number of stores for the years in which the number of stores is less than 5,000 . [4 marks] b) Write the Excel function that gives the average total generated revenue for the years in which Tesco's Central Europe division generated more than 4,000,000,000 in revenue. [4 marks] c) Write the Excel function that finds the sum of the generated revenue by Tesco's Bank division for the years where the total number of stores is greater than 5,000 . [4 marks] d) Write the Excel function that searches the spreadsheet to find '2021' and also the corresponding Total Revenue for that year. [6 marks] [Total Marks for Question 10=18] Question 11 a) Produce an appropriate fully labelled chart to compare each division's generated revenue over the last five recorded years. [10 marks] b) Interpret the chart produced in 11a). Discuss TWO probable justifications for the behaviour of the data. [4 marks] c) Produce a suitable and fully labelled chart to reflect each division's proportion of the total amount of revenue generated in 2019. [10 marks] [Total Marks for Question 11=24] \begin{tabular}{|l|c|c|c|r|r|r|} \hline & A & \multicolumn{1}{c}{ B } & \multicolumn{1}{c}{ C } & \multicolumn{1}{c}{ D } & \multicolumn{1}{c|}{ E } & \multicolumn{1}{c|}{F} \\ \hline 1 & \multicolumn{5}{|c|}{ Tesco Revenue by Location between 2018 and 2022 } & \\ \hline & Year & Number of stores & UK \& ROI Revenue (fm) & Central Europe Revenue (fm) & Tesco Bank Revenue (fm) & Total Revenue (fm) \\ \hline & & 38,656 & 6,343 & 1,047 & 46,046 \\ \hline 3 & 2018 & 7,033 & 44,883 & 6,030 & 1,097 & 52,010 \\ \hline 4 & 2019 & 6,993 & 45,752 & 3,968 & 1,068 & 50,788 \\ \hline 5 & 2020 & 4,613 & 48,848 & 3,862 & 735 & 53,445 \\ \hline 6 & 2021 & 4,673 & 49,984 & 3,862 & 922 & 54,768 \\ \hline & 2022 & 4,752 & & \end{tabular} Question 10 a) Write the Excel function that gives the total number of stores for the years in which the number of stores is less than 5,000 . [4 marks] b) Write the Excel function that gives the average total generated revenue for the years in which Tesco's Central Europe division generated more than 4,000,000,000 in revenue. [4 marks] c) Write the Excel function that finds the sum of the generated revenue by Tesco's Bank division for the years where the total number of stores is greater than 5,000 . [4 marks] d) Write the Excel function that searches the spreadsheet to find '2021' and also the corresponding Total Revenue for that year. [6 marks] [Total Marks for Question 10=18] Question 11 a) Produce an appropriate fully labelled chart to compare each division's generated revenue over the last five recorded years. [10 marks] b) Interpret the chart produced in 11a). Discuss TWO probable justifications for the behaviour of the data. [4 marks] c) Produce a suitable and fully labelled chart to reflect each division's proportion of the total amount of revenue generated in 2019. [10 marks] [Total Marks for Question 11=24]