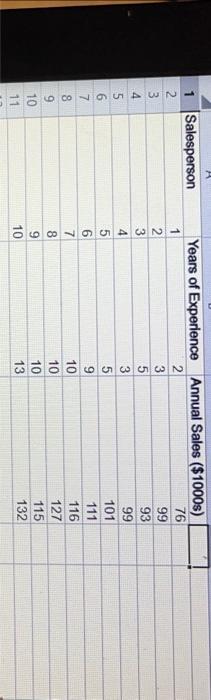
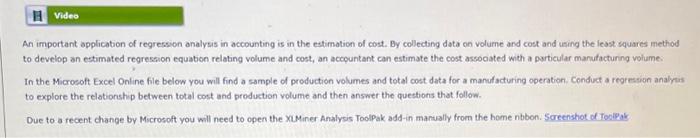
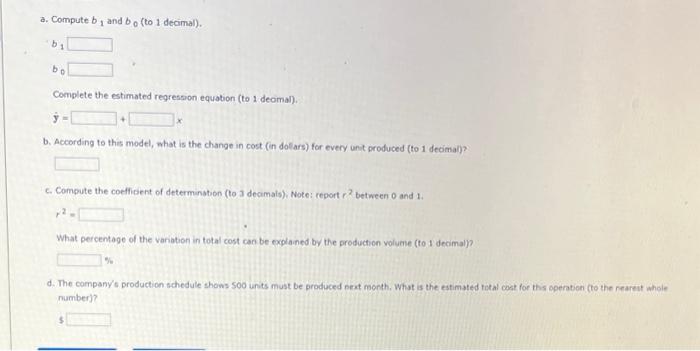
\begin{tabular}{|r|r|r|r|} \hline 1 & Salesperson & Years of Experience & Annual Sales (\$1000s) \\ \hline 2 & 1 & 2 & 76 \\ \hline 3 & 2 & 3 & 99 \\ \hline 4 & 3 & 5 & 93 \\ \hline 5 & 4 & 3 & 99 \\ \hline 6 & 5 & 5 & 101 \\ \hline 7 & 6 & 9 & 111 \\ \hline 8 & 7 & 10 & 116 \\ \hline 9 & 8 & 10 & 127 \\ \hline 10 & 9 & 10 & 115 \\ \hline 11 & 10 & 13 & 132 \\ \hline \end{tabular} An important application of regression analysis in accounting is in the estimation of cost. By collecting data on volume and cost and using the lest squares method to develop an estimated regression equation relating volume and cost, an accountant can estimate the cost assoaated with a particular manufacturng volume: In the Microsoft Excel Online file below you will find a sample of production volumes and total cost data for a manufacturing operation. Conduct a regrestion analytis to explore the relationship between total cost and production volume and then answer the questions that follow. Due to a recent change by Microsoft you will need to open the XIMiner Analysis Toolpak add-in manually from the home nbbon. Sareenshot of Tosile at a. Compute b1 and b0 (to 1 decimal). b1 b0 Complete the estimated regression equation (to 1 deomal). y= b. According to this model, ahat is the change in cost (in dolars) for every unt produced (to 1 decimai)? c. Compute the coeflicient of determination (to 3 decimals), Note: report r2 between 0 and 1 . r2= What percentage of the variation in total cost can be explained by the production volume (to 1 decimal)? 4 d. The company's production schedule shows 500 units must be produced pest month, What is the estimated tical coat for ths opention (to the reareit whole number)? 5 \begin{tabular}{|r|r|r|r|} \hline 1 & Salesperson & Years of Experience & Annual Sales (\$1000s) \\ \hline 2 & 1 & 2 & 76 \\ \hline 3 & 2 & 3 & 99 \\ \hline 4 & 3 & 5 & 93 \\ \hline 5 & 4 & 3 & 99 \\ \hline 6 & 5 & 5 & 101 \\ \hline 7 & 6 & 9 & 111 \\ \hline 8 & 7 & 10 & 116 \\ \hline 9 & 8 & 10 & 127 \\ \hline 10 & 9 & 10 & 115 \\ \hline 11 & 10 & 13 & 132 \\ \hline \end{tabular} An important application of regression analysis in accounting is in the estimation of cost. By collecting data on volume and cost and using the lest squares method to develop an estimated regression equation relating volume and cost, an accountant can estimate the cost assoaated with a particular manufacturng volume: In the Microsoft Excel Online file below you will find a sample of production volumes and total cost data for a manufacturing operation. Conduct a regrestion analytis to explore the relationship between total cost and production volume and then answer the questions that follow. Due to a recent change by Microsoft you will need to open the XIMiner Analysis Toolpak add-in manually from the home nbbon. Sareenshot of Tosile at a. Compute b1 and b0 (to 1 decimal). b1 b0 Complete the estimated regression equation (to 1 deomal). y= b. According to this model, ahat is the change in cost (in dolars) for every unt produced (to 1 decimai)? c. Compute the coeflicient of determination (to 3 decimals), Note: report r2 between 0 and 1 . r2= What percentage of the variation in total cost can be explained by the production volume (to 1 decimal)? 4 d. The company's production schedule shows 500 units must be produced pest month, What is the estimated tical coat for ths opention (to the reareit whole number)? 5