Question
Behavioral Finance: you need to answer six question related to this topic. 1. What exactly is the stock market participation rate? How is it computed?
Behavioral Finance:
you need to answer six question related to this topic.
1. What exactly is the stock market participation rate? How is it computed? Why is it so important to the society?
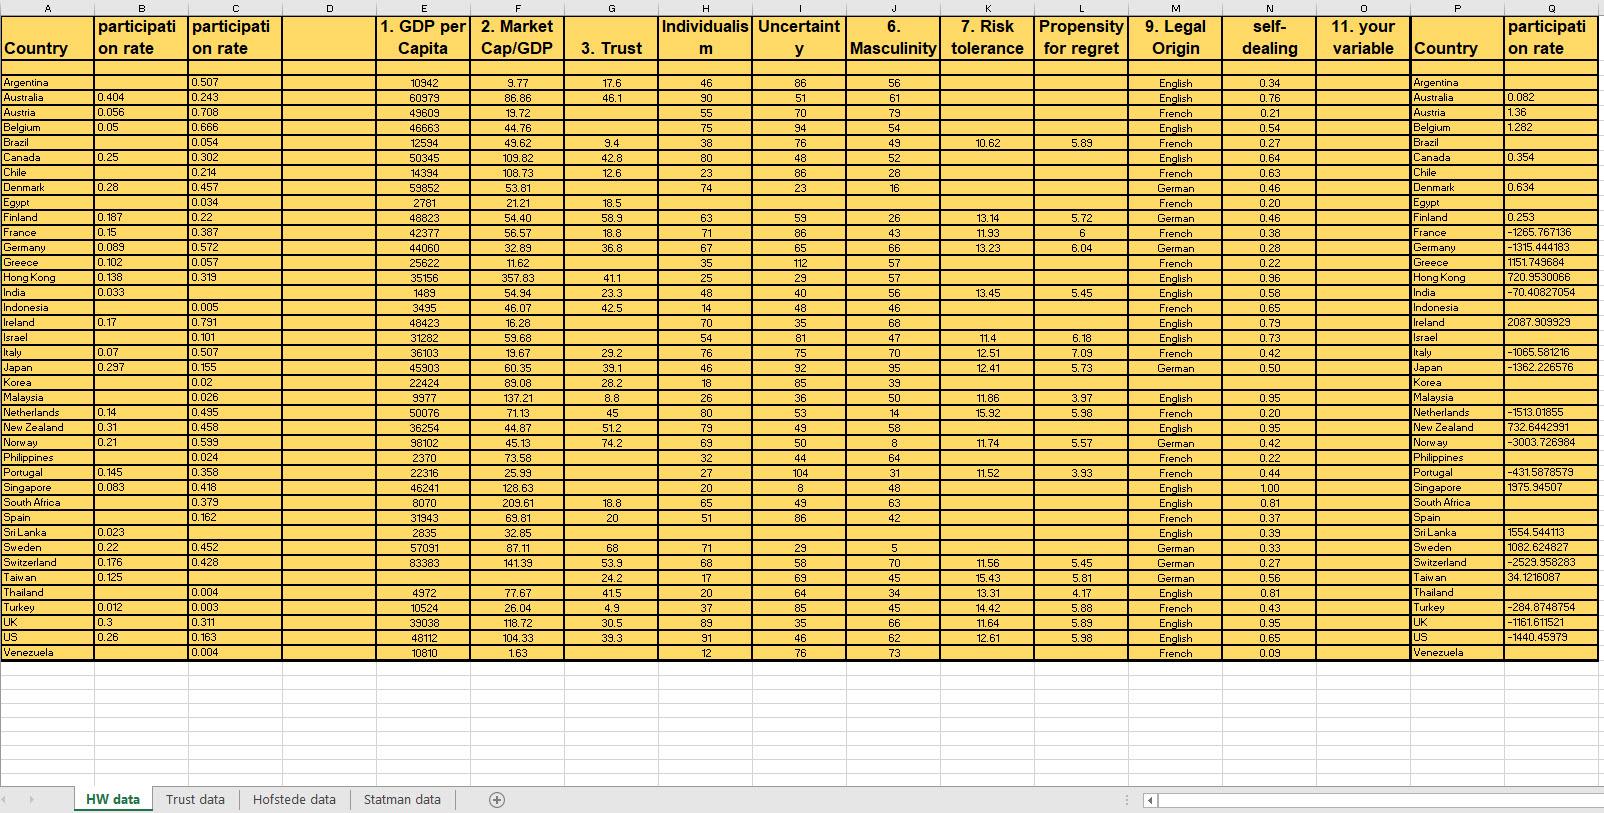
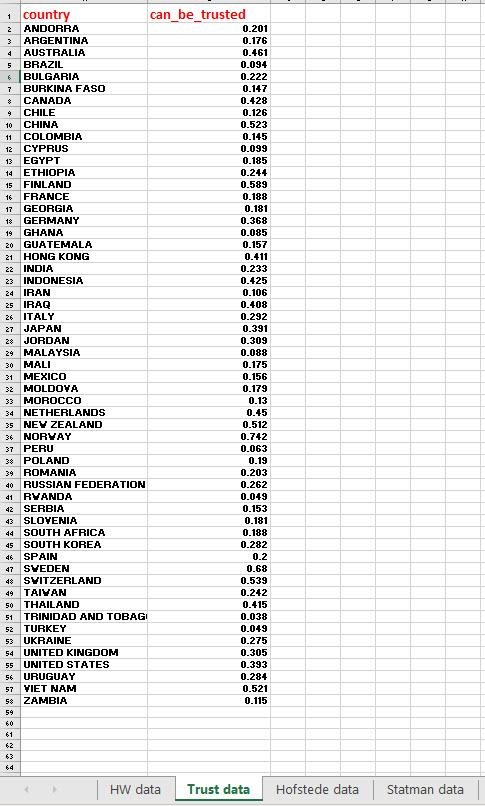
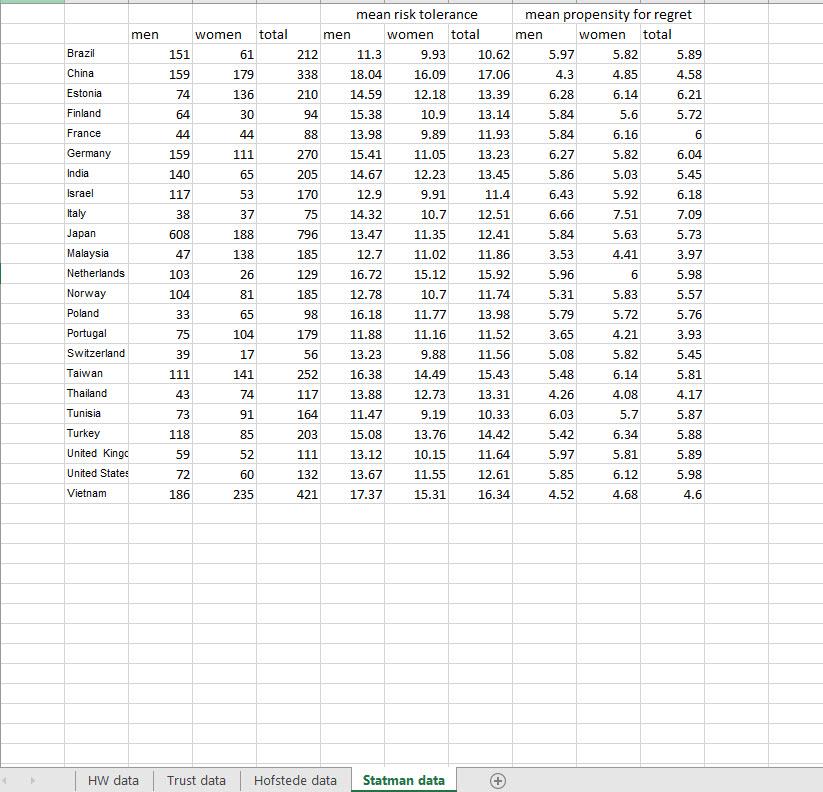
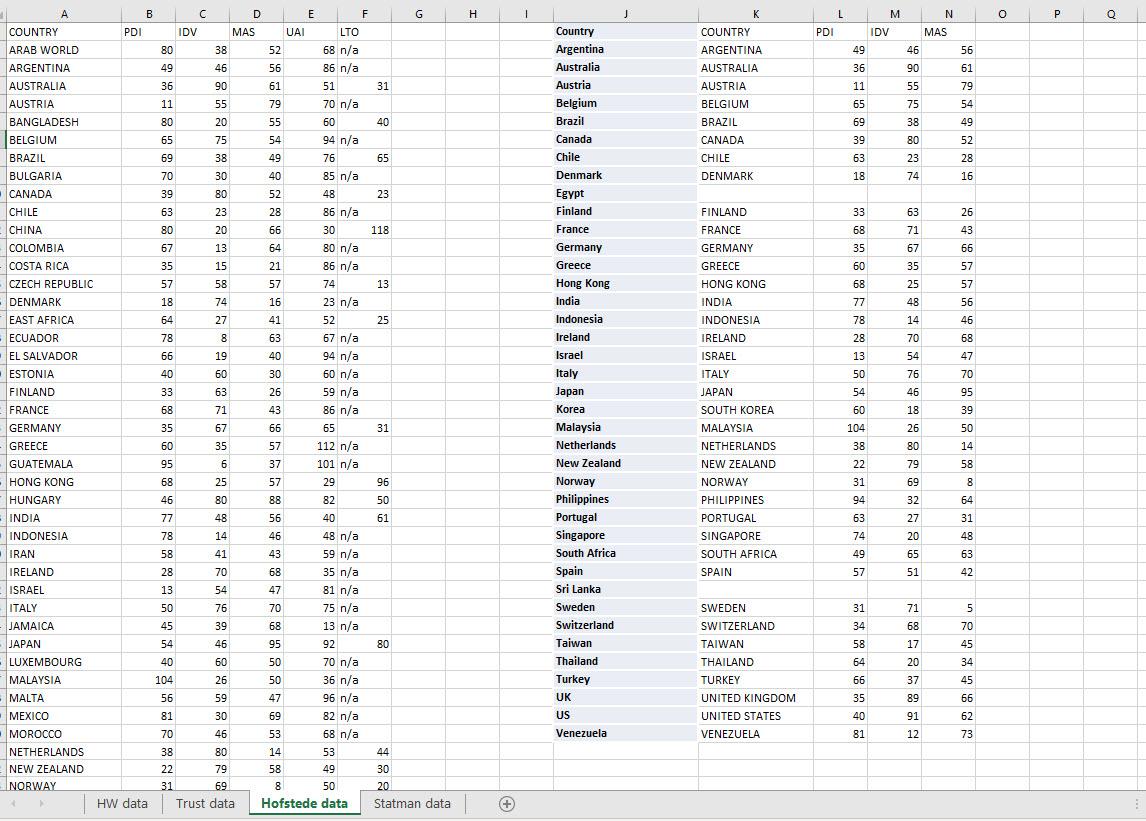
2. Data collection: Briefly describe each data series used in this homework in a few sentences. What do they measure? How are the data collected, etc.?
Variables and their sources:
-GDP per capita World Bank
-Market capitalization/GDP - World Bank
-Trust World Values Survey
-Individualism Geert Hofstedes website
-Uncertainty Avoidance - Geert Hofstedes website
-Masculinity - Geert Hofstedes website
-Risk tolerance Meir Statmans Culture in Risk, Regret, Maximization, Social Trust, and Life Satisfaction
-Propensity for regret Meir Statmans Culture in Risk, Regret, Maximization, Social Trust, and Life Satisfaction
-Legal Origin Raphael LaPortas website
-Anti-self-dealing Index - Raphael LaPortas website
-Variable that you choose (that relates to culture or behavior. Explain why you picked this variable)
3. What behavioral bias might be related to each of the three Hofstede variables: Masculinity, Uncertainty avoidance, and Individualism?
4. For each of the variables 1-11, state whether you expect positive or negative or insignificant correlation between domestic and foreign market participation rates and the variable (+, -, 0)
5. Test whether there is correlation between domestic and foreign market participation rates and the variables 1-11 (perhaps generate a correlation matrix). Summarize your findings. Do you find consistent with your expectations in part 4. If not, why do you think that is? (Part 6 might help in answering this question)
6. Test if there is a positive correlation between the cultural and behavioral variables (variables 3-11) and domestic and foreign market participation rates if you also control for the market cap/GDP and GDP per capita, perhaps by using the regression tool.


Step by Step Solution
There are 3 Steps involved in it
Step: 1

Get Instant Access to Expert-Tailored Solutions
See step-by-step solutions with expert insights and AI powered tools for academic success
Step: 2

Step: 3

Ace Your Homework with AI
Get the answers you need in no time with our AI-driven, step-by-step assistance
Get Started


