

Answered step by step
Verified Expert Solution
Question
1 Approved Answer
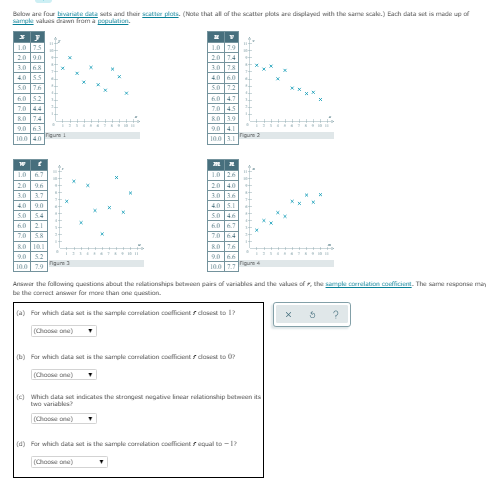
Below and four Livariate dila sits and their meallin plots. (Note that all of the scatter plots are displayed with the same scake.) Each data
Step by Step Solution
There are 3 Steps involved in it
Step: 1

Get Instant Access to Expert-Tailored Solutions
See step-by-step solutions with expert insights and AI powered tools for academic success
Step: 2

Step: 3
Ace Your Homework with AI
Get the answers you need in no time with our AI-driven, step-by-step assistance
Get Started
Finite Mathematics
Authors: Stefan Waner, Jerry Lee Ford Jr, Waner/Costenoble, Steven Costenoble
5th Edition
1111789304, 9781111789305