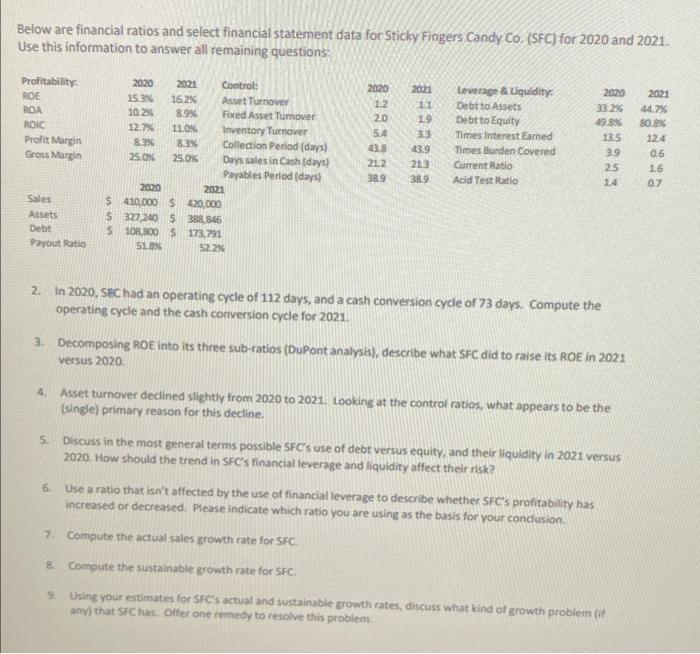
Below are financial ratios and select financial statement data for Sticky Fingers Candy Co. (SFC) for 2020 and 2021. Use this information to answer all remaining questions 2020 2021 12 Profitability: ROE ROA ROIC Profit Margin Gross Margin 2020 2021 Control: 15.3 16.2% Asset Turnover 10.2% 8.9% Fixed Asset Tumover 127% 110X Inventory Turnover 8.396 8.3% Collection Period (days! 25.0 25.0% Days sales in Cash (days! Payables Period (days 2020 2021 5410,000 $420,000 $ 327.200 S 388846 $ 108,800 $ 173.791 51. 522% 20 5.4 38 212 38.9 1.9 3.3 1319 213 38.9 Leverage & Liquidity Debt to Assets Debt to Equity Times Interest Eamed Times Burden Covered Current Ratio Add Test Ratio 2020 33.236 19.896 13.5 39 25 14 2021 44.7% 80.8% 124 06 16 07 Sales Assets Debt Payout Ratio 2 In 2020, SEC had an operating cycle of 112 days, and a cash conversion cycle of 73 days. Compute the operating cycle and the cash conversion cycle for 2021 3. Decomposing ROE into its three sub-ratios (DuPont analysis), describe what SFC did to raise its ROE in 2021 versus 2020 4. Asset turnover declined slightly from 2020 to 2021. Looking at the control ratios, what appears to be the (single) primary reason for this decline 5 Discuss in the most general terms possible SFC's use of debt versus equity, and their liquidity in 2021 versus 2020. How should the trend in SFC's financial leverage and liquidity affect thelr risk? 6. Use a ratio that isn't affected by the use of financial leverage to describe whether 5FC's profitability has increased or decreased. Please indicate which ratio you are using as the basis for your conclusion 7. Compute the actual sales growth rate for SFC. & Compute the sustainable growth rate for SFC. 9. Using your estimates for SFC's actual and sustainable growth rates, discuss what kind of growth problem of any that SFC has. Offer one remedy to resolve this problem Below are financial ratios and select financial statement data for Sticky Fingers Candy Co. (SFC) for 2020 and 2021. Use this information to answer all remaining questions 2020 2021 12 Profitability: ROE ROA ROIC Profit Margin Gross Margin 2020 2021 Control: 15.3 16.2% Asset Turnover 10.2% 8.9% Fixed Asset Tumover 127% 110X Inventory Turnover 8.396 8.3% Collection Period (days! 25.0 25.0% Days sales in Cash (days! Payables Period (days 2020 2021 5410,000 $420,000 $ 327.200 S 388846 $ 108,800 $ 173.791 51. 522% 20 5.4 38 212 38.9 1.9 3.3 1319 213 38.9 Leverage & Liquidity Debt to Assets Debt to Equity Times Interest Eamed Times Burden Covered Current Ratio Add Test Ratio 2020 33.236 19.896 13.5 39 25 14 2021 44.7% 80.8% 124 06 16 07 Sales Assets Debt Payout Ratio 2 In 2020, SEC had an operating cycle of 112 days, and a cash conversion cycle of 73 days. Compute the operating cycle and the cash conversion cycle for 2021 3. Decomposing ROE into its three sub-ratios (DuPont analysis), describe what SFC did to raise its ROE in 2021 versus 2020 4. Asset turnover declined slightly from 2020 to 2021. Looking at the control ratios, what appears to be the (single) primary reason for this decline 5 Discuss in the most general terms possible SFC's use of debt versus equity, and their liquidity in 2021 versus 2020. How should the trend in SFC's financial leverage and liquidity affect thelr risk? 6. Use a ratio that isn't affected by the use of financial leverage to describe whether 5FC's profitability has increased or decreased. Please indicate which ratio you are using as the basis for your conclusion 7. Compute the actual sales growth rate for SFC. & Compute the sustainable growth rate for SFC. 9. Using your estimates for SFC's actual and sustainable growth rates, discuss what kind of growth problem of any that SFC has. Offer one remedy to resolve this


