

Answered step by step
Verified Expert Solution
Question
1 Approved Answer
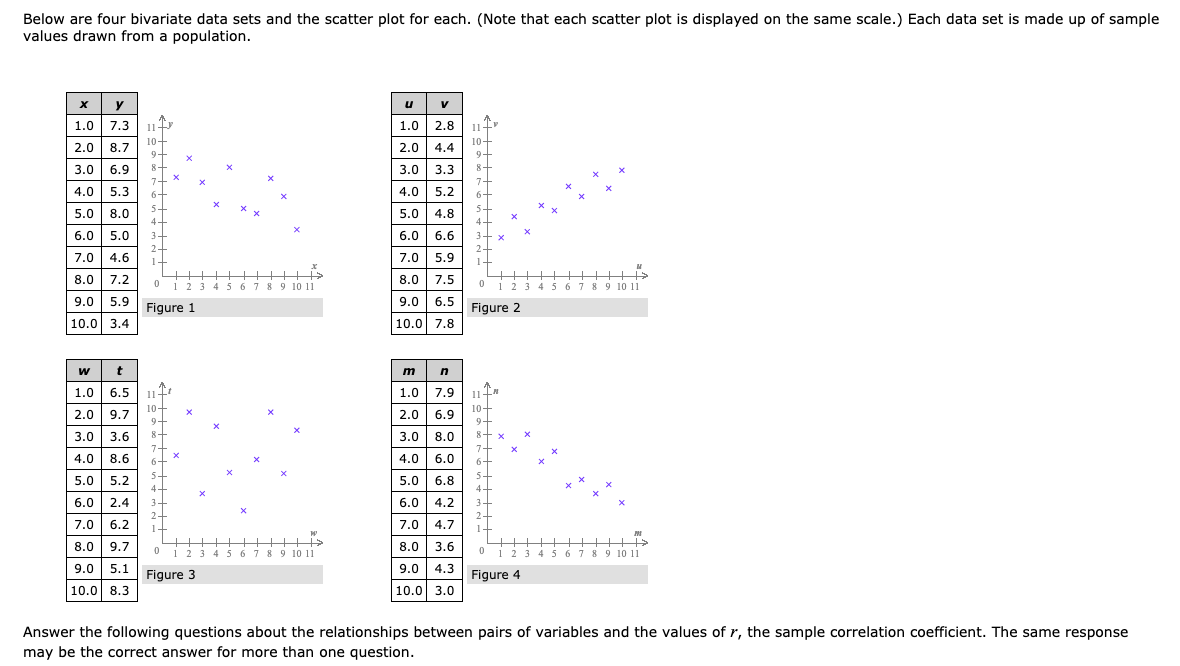
Below are four bivariate data sets and the scatter plot for each. (Note that each scatter plot is displayed on the same scale.) Each data
Step by Step Solution
There are 3 Steps involved in it
Step: 1

Get Instant Access to Expert-Tailored Solutions
See step-by-step solutions with expert insights and AI powered tools for academic success
Step: 2

Step: 3
Ace Your Homework with AI
Get the answers you need in no time with our AI-driven, step-by-step assistance
Get Started
Algebra 2
Authors: Randall I. Charles, Basia Hall, Dan Kennedy, Laurie E Bass
Student Edition
0133500438, 978-0133500431