

Answered step by step
Verified Expert Solution
Question
1 Approved Answer
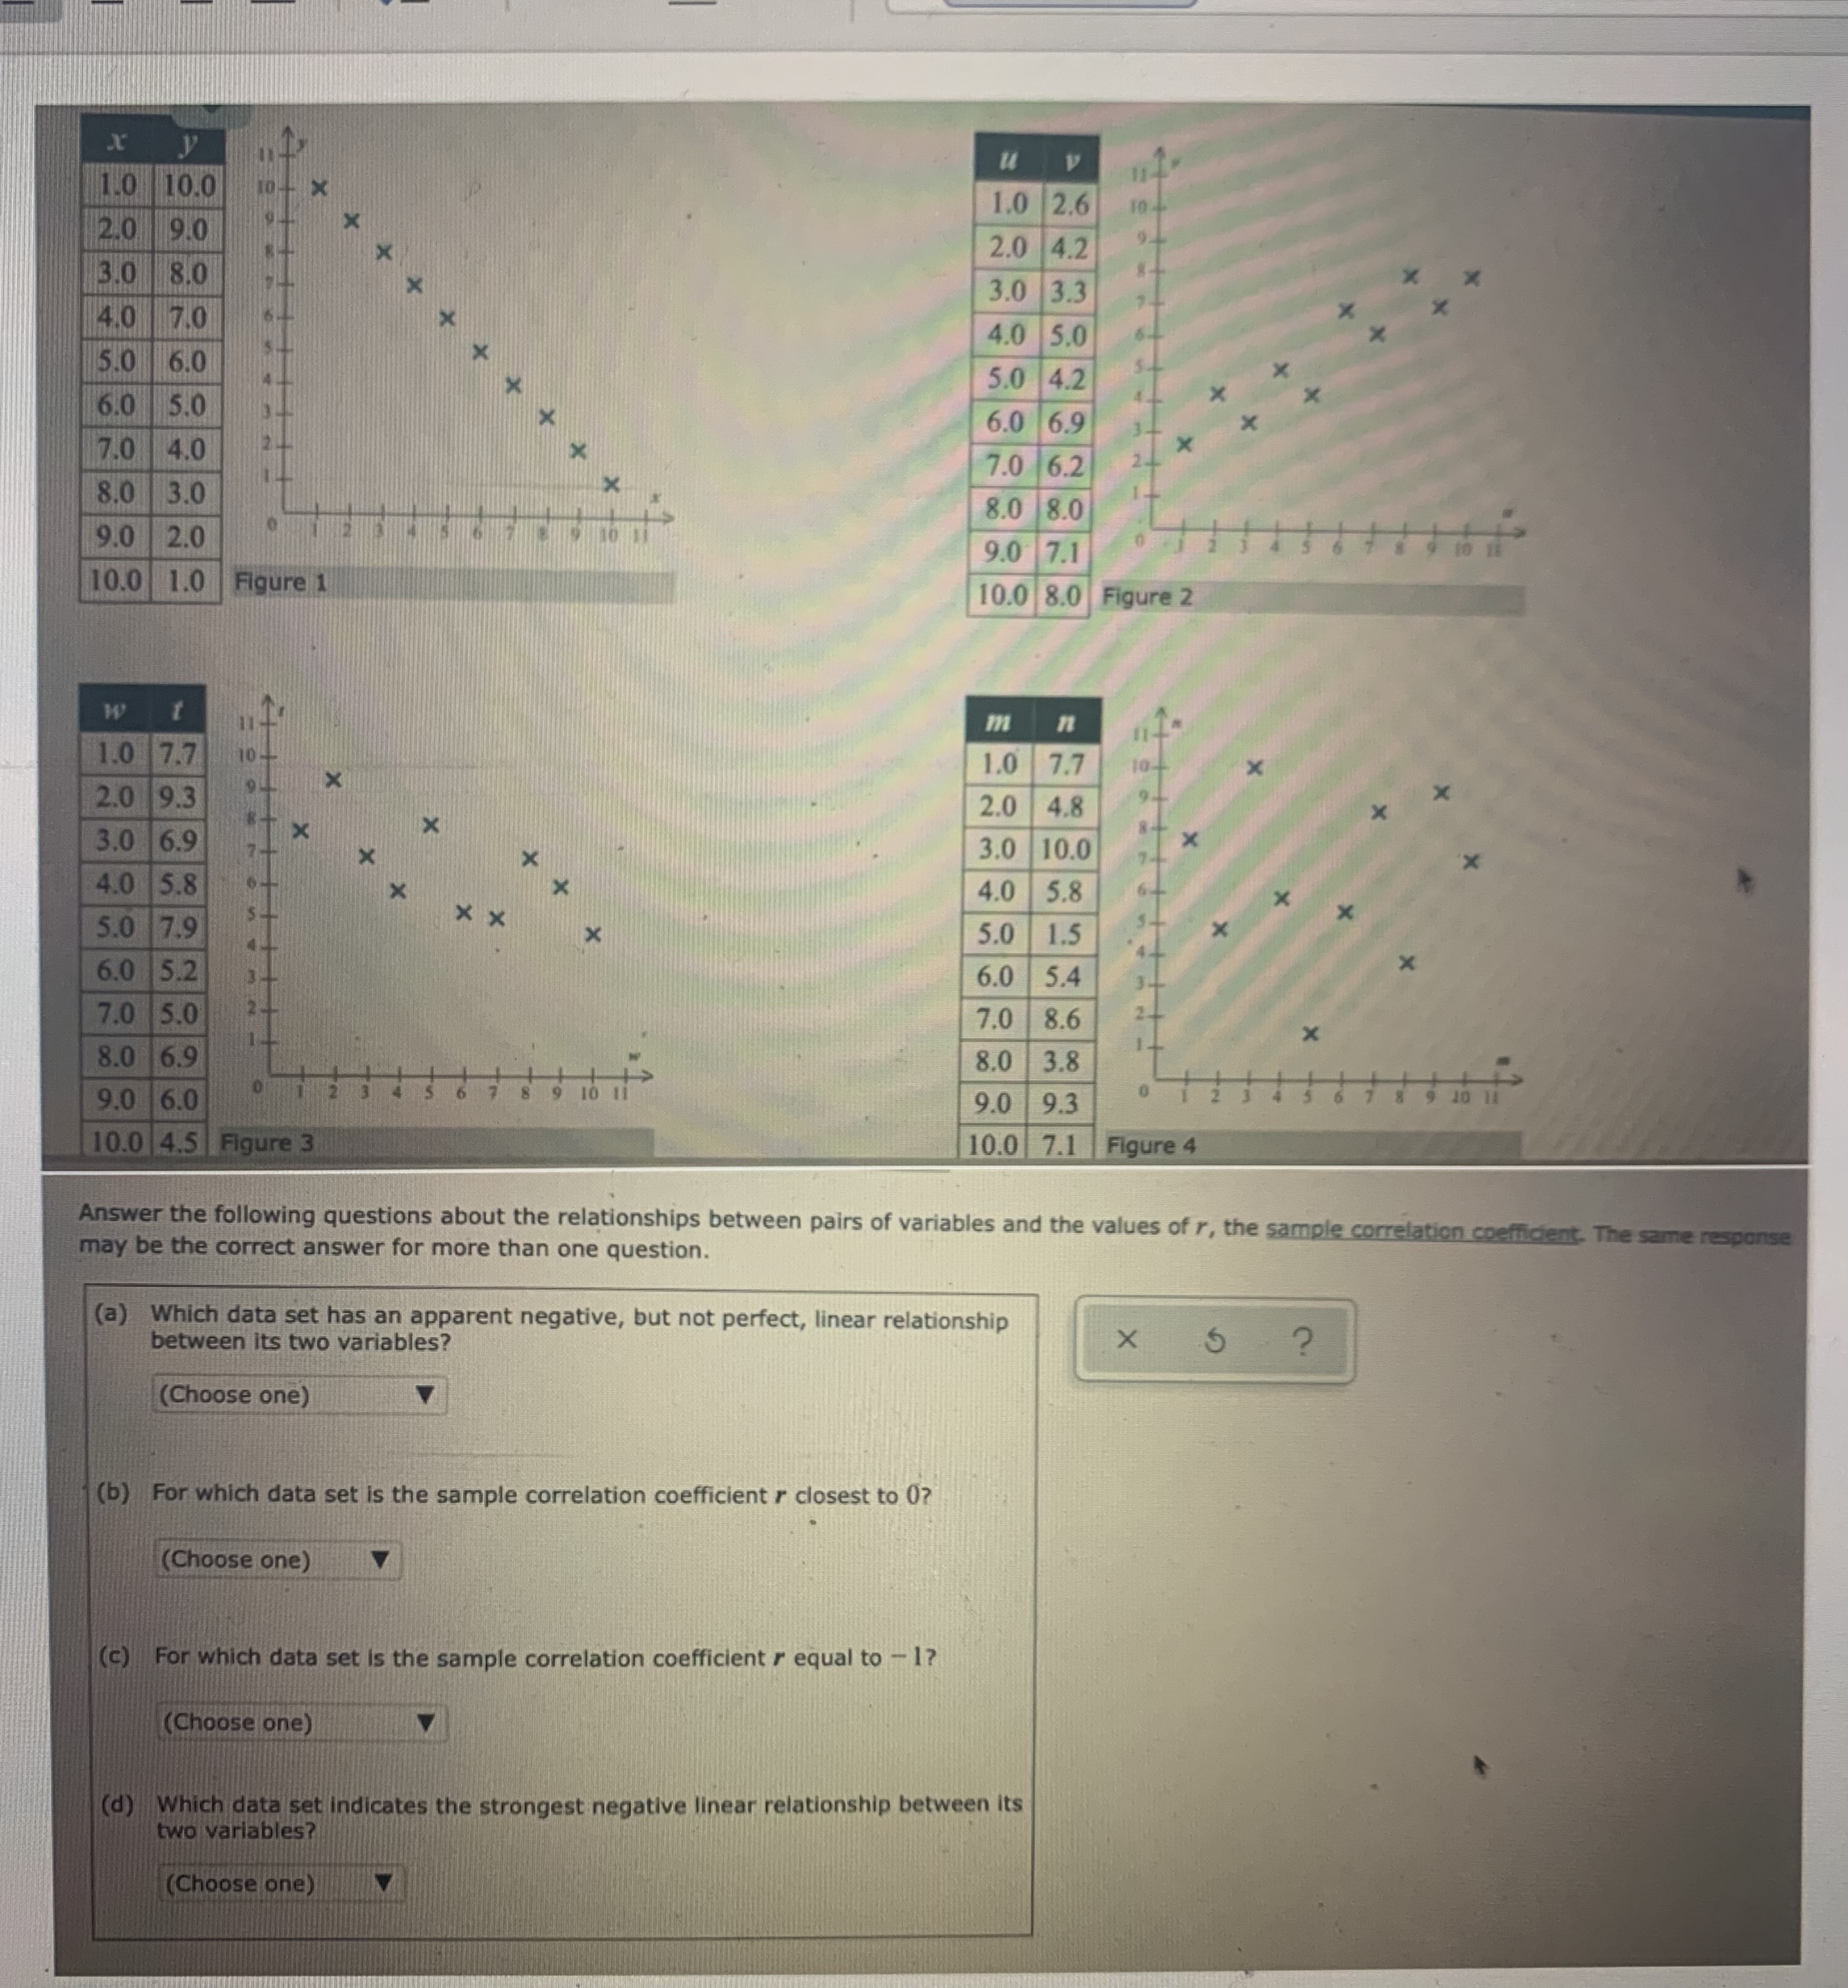
Below are four bivariate data sets and their scatter plots. (Note that all of the scatter plots are displayed with the same scale.) Each data
Below are four bivariate data sets and their scatter plots. (Note that all of the scatter plots are displayed with the same scale.) Each data set is made up of sample values drawn from a population.
Step by Step Solution
There are 3 Steps involved in it
Step: 1

Get Instant Access to Expert-Tailored Solutions
See step-by-step solutions with expert insights and AI powered tools for academic success
Step: 2

Step: 3
Ace Your Homework with AI
Get the answers you need in no time with our AI-driven, step-by-step assistance
Get Started
Calculus
Authors: Laura Taalman, Peter Kohn
1st Edition
1464153035, 9781464153037