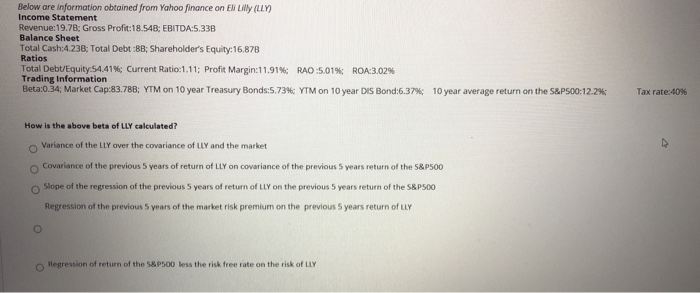
Below are information obtained from Yahoo finance on Eli Lilly (LLY) Income Statement Revenue:19.7B: Gross Profit:18.54B: EBITDA:5.33B Balance Sheet Total Cash:4.238; Total Debt :8B; Shareholder's Equity:16.878 Ratios Total Debt/Equity 54.41%; Current Ratio:1.11; Profit Margin:11.91% RAO:5,01%; ROA:3.02% Trading Information Beta:0.34; Market Cap:83.78B; YTM on 10 year Treasury Bonds:5.734: YTM on 10 year DIS Bond:6.37% 10 year average return on the S&P500:12.2% Tax rate:40% How is the above beta of LLY calculated? Variance of the LLY over the covariance of LLY and the market Covariance of the previous 5 years of return of LLY on covariance of the previous 5 years return of the S&P500 Slope of the regression of the previous 5 years of return of LLY on the previous 5 years return of the S&P500 Regression of the previous 5 years of the market risk premium on the previous 5 years return of LLY Regression of return of the S&P500 less the risk free rate on the risk of LLY Below are information obtained from Yahoo finance on EN Lilly (LY) Income Statement Revenue:19.78: Gross Profit:18.548; EBITDA 5.33B Balance Sheet Total Cash:4.238; Total Debt 88 Shareholder's Equity 16.878 Ratios Total Debt/Equity 54418: Current Ratio:1.11: Profit Margin:11.91% Trading Information Beta 0.14; Market Cap 83.788; YTM on 10 year Treasury Bonds:5.73 RAO:5.01% ROA3.02% YTM on 10 year Di Bond:6,37 10 year average return on the S&P500:12.2% Tax rate: 40% How is the above beta of LLY calculated? Variance of the Lly over the covariance of LLY and the market Covariance of the previous 5 years of return of LLY on covariance of the previous 5 years return of the S&P500 Slope of the regression of the previous 5 years of return of Lly on the previous 5 years return of the S&P500 Regression of the previous 5 years of the market risk premium on the previous 5 years return of LLY Regression of return of the S&P500 less the risk free rate on the risk of LLY Below are information obtained from Yahoo finance on Eli Lilly (LLY) Income Statement Revenue:19.7B: Gross Profit:18.54B: EBITDA:5.33B Balance Sheet Total Cash:4.238; Total Debt :8B; Shareholder's Equity:16.878 Ratios Total Debt/Equity 54.41%; Current Ratio:1.11; Profit Margin:11.91% RAO:5,01%; ROA:3.02% Trading Information Beta:0.34; Market Cap:83.78B; YTM on 10 year Treasury Bonds:5.734: YTM on 10 year DIS Bond:6.37% 10 year average return on the S&P500:12.2% Tax rate:40% How is the above beta of LLY calculated? Variance of the LLY over the covariance of LLY and the market Covariance of the previous 5 years of return of LLY on covariance of the previous 5 years return of the S&P500 Slope of the regression of the previous 5 years of return of LLY on the previous 5 years return of the S&P500 Regression of the previous 5 years of the market risk premium on the previous 5 years return of LLY Regression of return of the S&P500 less the risk free rate on the risk of LLY Below are information obtained from Yahoo finance on EN Lilly (LY) Income Statement Revenue:19.78: Gross Profit:18.548; EBITDA 5.33B Balance Sheet Total Cash:4.238; Total Debt 88 Shareholder's Equity 16.878 Ratios Total Debt/Equity 54418: Current Ratio:1.11: Profit Margin:11.91% Trading Information Beta 0.14; Market Cap 83.788; YTM on 10 year Treasury Bonds:5.73 RAO:5.01% ROA3.02% YTM on 10 year Di Bond:6,37 10 year average return on the S&P500:12.2% Tax rate: 40% How is the above beta of LLY calculated? Variance of the Lly over the covariance of LLY and the market Covariance of the previous 5 years of return of LLY on covariance of the previous 5 years return of the S&P500 Slope of the regression of the previous 5 years of return of Lly on the previous 5 years return of the S&P500 Regression of the previous 5 years of the market risk premium on the previous 5 years return of LLY Regression of return of the S&P500 less the risk free rate on the risk of LLY


