Answered step by step
Verified Expert Solution
Question
1 Approved Answer
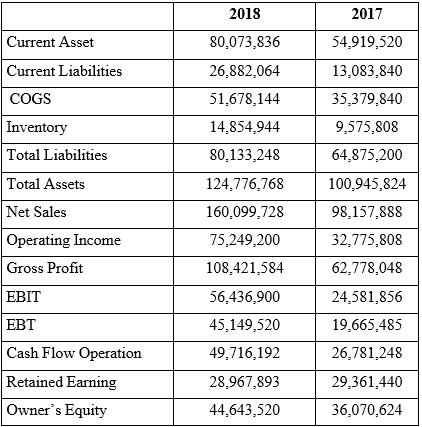
Below are several accounts in a trading company's financial report: Calculate the ratio for 2018 and 2017 below and provide your interpretation of the company's
Below are several accounts in a trading company's financial report:

Calculate the ratio for 2018 and 2017 below and provide your interpretation of the company's financial performance based on the ratio calculation!
- Current ratio
- Inventory turnover
- Working capital
- Debt ratio
- Debt to Equity Ratio
- Total Asset Turnover
- Operating Income Margin
- Gross Profit Margin
- Degree of Financial Leverage
- Operating Cash flow to Total Debt
Current Asset Current Liabilities COGS Inventory Total Liabilities Total Assets Net Sales Operating Income Gross Profit EBIT EBT Cash Flow Operation Retained Earning Owner's Equity 2018 80,073,836 26,882,064 51,678,144 14,854,944 80,133,248 124,776,768 160,099,728 75,249,200 108,421,584 56,436,900 45,149,520 49,716,192 28,967,893 44,643,520 2017 54,919,520 13,083,840 35,379,840 9,575,808 64,875,200 100,945,824 98,157,888 32,775,808 62,778,048 24,581,856 19,665,485 26,781,248 29,361,440 36,070,624
Step by Step Solution
★★★★★
3.46 Rating (159 Votes )
There are 3 Steps involved in it
Step: 1
To analyze the companys financial performance based on the given ratios lets calculate each ratio for the years 2018 and 2017 using the provided financial data Current Ratio Current Ratio Current Asse...
Get Instant Access to Expert-Tailored Solutions
See step-by-step solutions with expert insights and AI powered tools for academic success
Step: 2

Step: 3

Ace Your Homework with AI
Get the answers you need in no time with our AI-driven, step-by-step assistance
Get Started


