You have been hired by the Regional Real Estate Company to help them analyze real estate data. One of the companys Pacific region salespeople just
You have been hired by the Regional Real Estate Company to help them analyze real estate data. One of the company’s Pacific region salespeople just returned to the office with a newly designed advertisement. It states that the average cost per square foot of his home sales is above the average cost per square foot in the Pacific region. He wants you to make sure he can make that statement before approving the use of the advertisement. The average cost per square foot of his home sales is $275. In order to test his claim, you collect a sample of 1,001 home sales for the Pacific region.
Prompt
Design a hypothesis test and interpret the results using significance level α = .05.
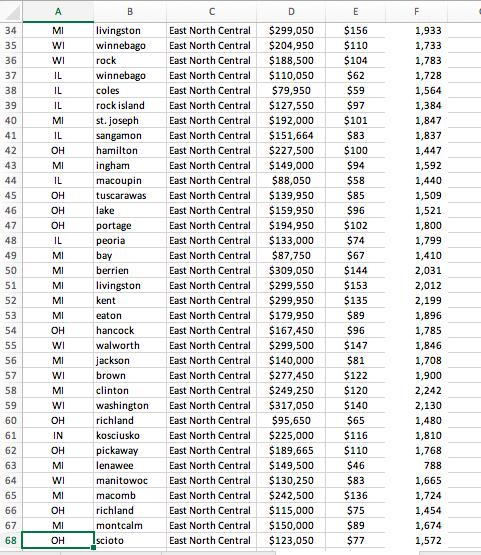
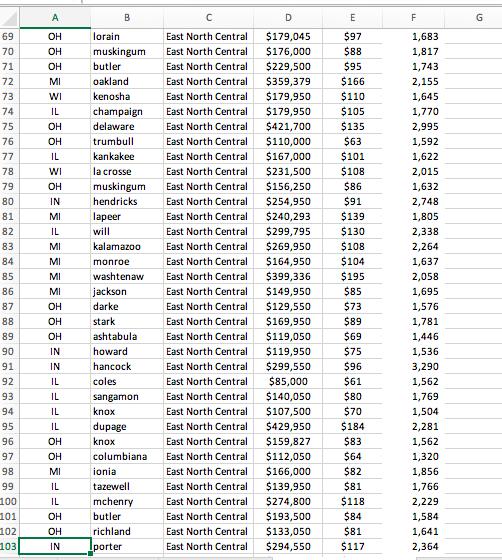
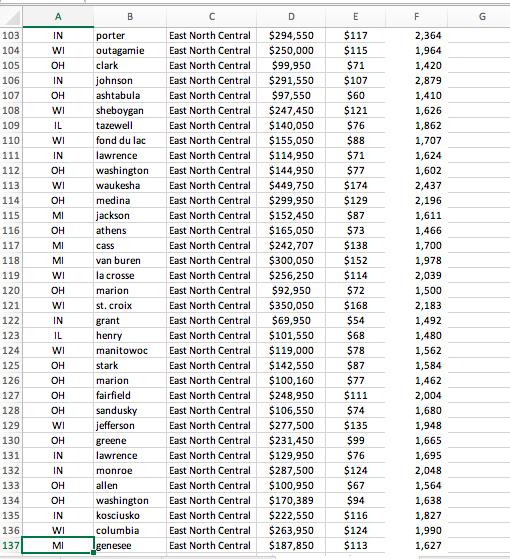
Use the House Listing Price by Region document to help support your work on this assignment.
The population options are: New England, Mid Atlantic, South Atlantic, east north central, east south central, mountain, pacific, west north central, west south central.
- Setup: Define your population parameter, including hypothesis statements, and specify the appropriate test.
- Define your population parameter.
- Write the null and alternative hypotheses. Note: Remember, the salesperson believes that his sales are higher.
- Specify the name of the test you will use.
- Identify whether it is a left-tailed, right-tailed, or two-tailed test.
- Identify your significance level.
- Data Analysis Preparations: Describe sample summary statistics, provide a histogram and summary, check assumptions, and find the test statistic and significance level.
- Provide the descriptive statistics (sample size, mean, median, and standard deviation).
- Provide a histogram of your sample.
- Describe your sample by writing a sentence describing the shape, center, and spread of your sample.
- Determine whether the conditions to perform your identified test have been met.
- Calculations: Calculate the p value, describe the p value and test statistic in regard to the normal curve graph, discuss how the p value relates to the significance level, and compare the p value to the significance level to reject or fail to reject the null hypothesis.
- Determine the appropriate test statistic, then calculate the test statistic.
Note: This calculation is (mean – target)/standard error. In this case, the mean is your regional mean (Pacific), and the target is 275. - Calculate the p value.
Note: For right-tailed, use the T.DIST.RT function in Excel, left-tailed is the T.DIST function, and two-tailed is the T.DIST.2T function. The degree of freedom is calculated by subtracting 1 from your sample size.
Choose your test from the following:
=T.DIST.RT([test statistic], [degree of freedom])
=T.DIST([test statistic], [degree of freedom], 1)
=T.DIST.2T([test statistic], [degree of freedom]) - Using the normal curve graph as a reference, describe where the p value and test statistic would be placed.
- Determine the appropriate test statistic, then calculate the test statistic.
- Test Decision: Discuss the relationship between the p value and the significance level, including a comparison between the two, and decide to reject or fail to reject the null hypothesis.
- Discuss how the p value relates to the significance level.
- Compare the p value and significance level, and make a decision to reject or fail to reject the null hypothesis.
- Conclusion: Discuss how your test relates to the hypothesis and discuss the statistical significance.
- Explain in one paragraph how your test decision relates to your hypothesis and whether your conclusions are statistically significant.
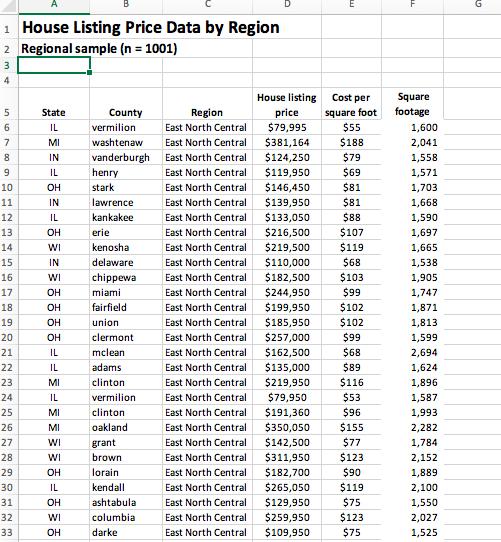
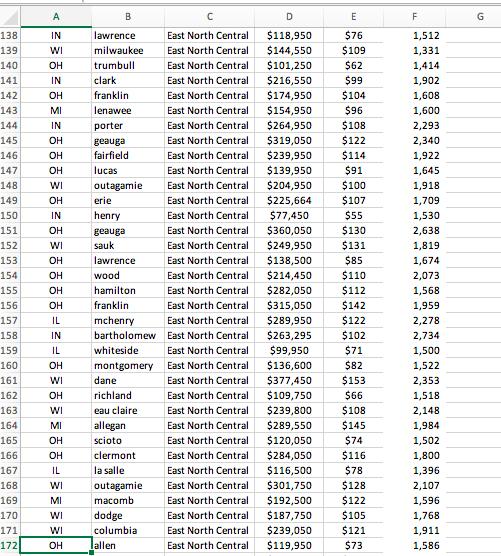
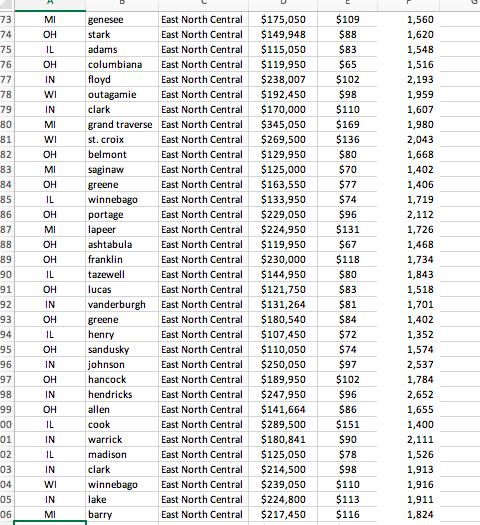
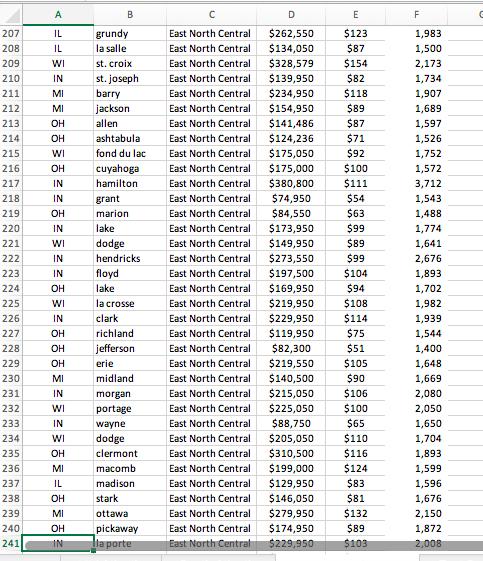
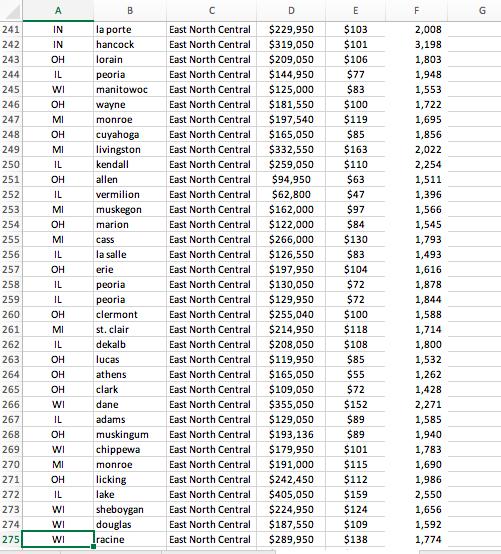
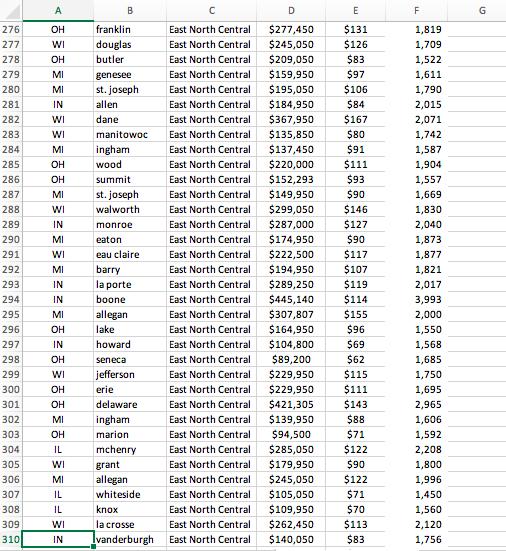
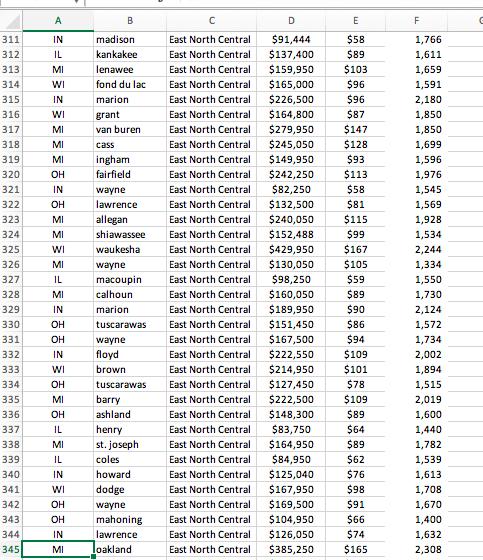
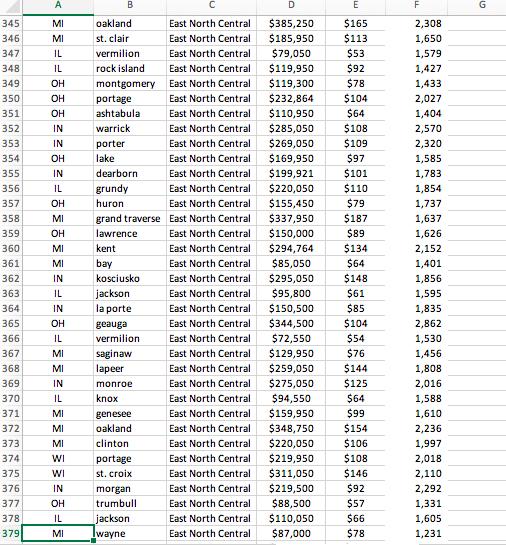
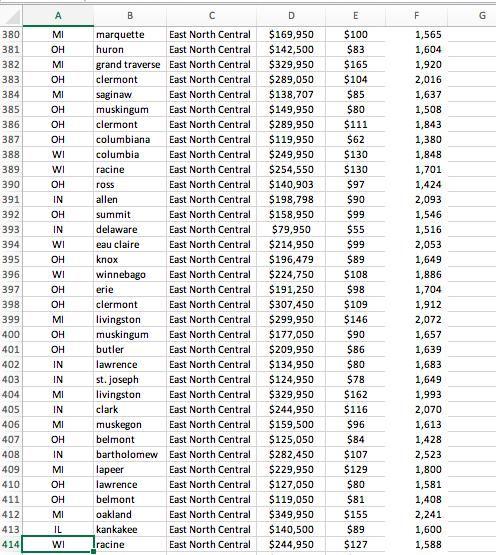
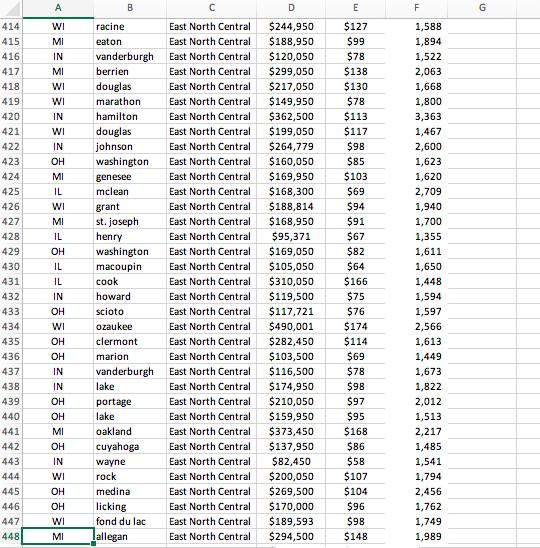
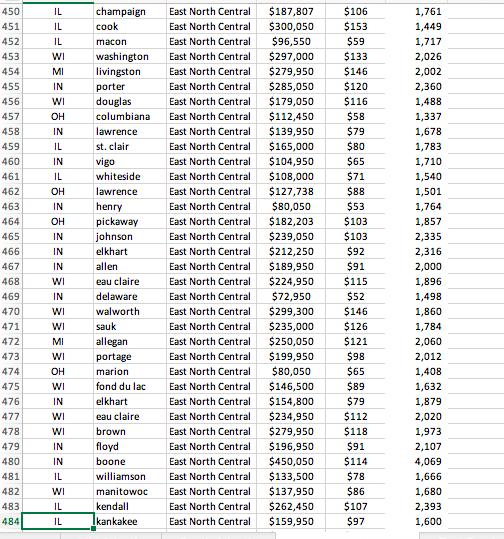
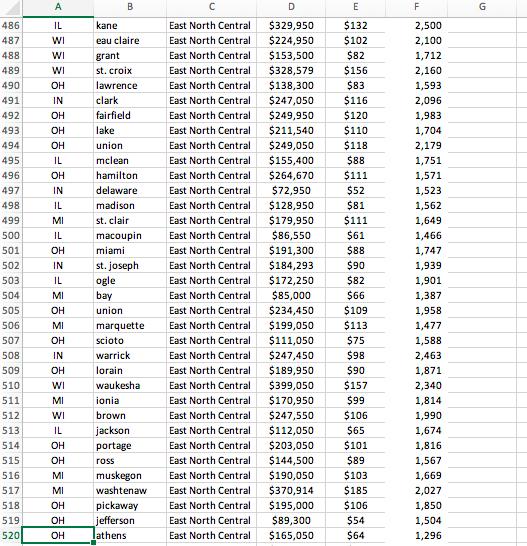
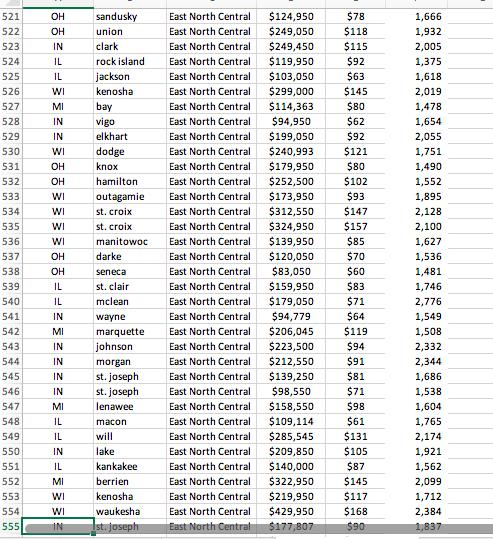
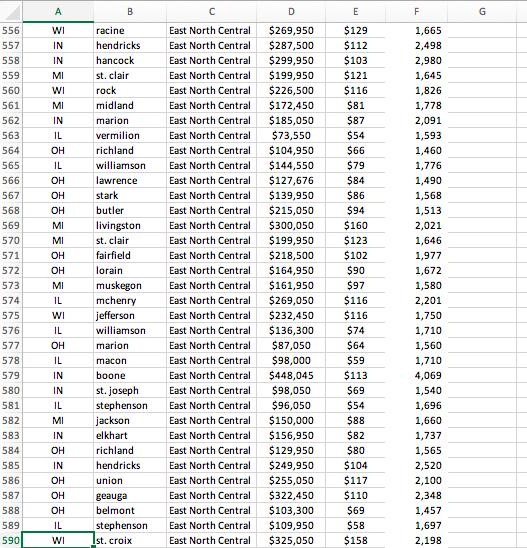
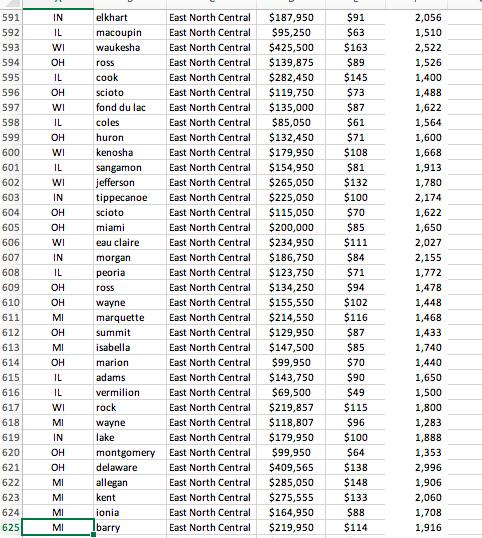
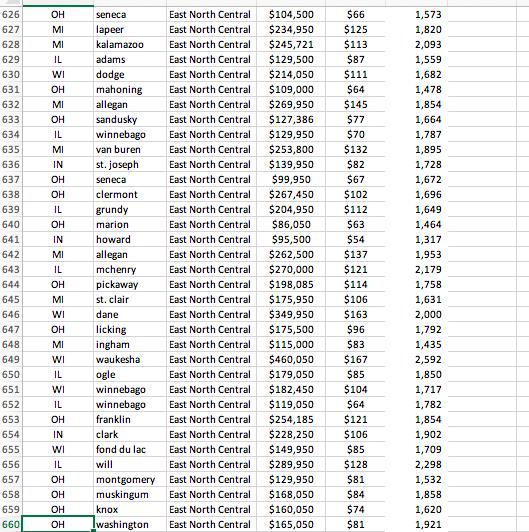
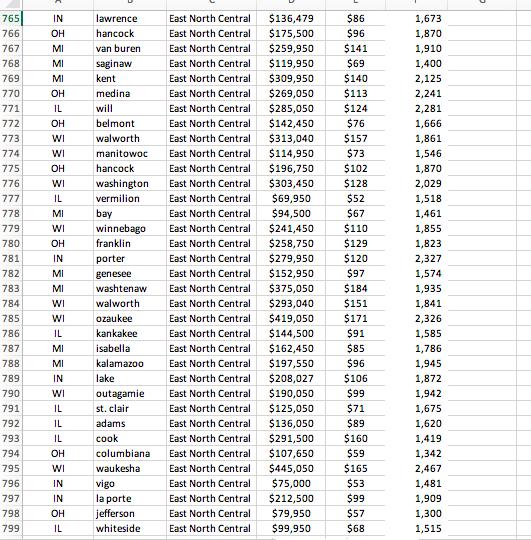
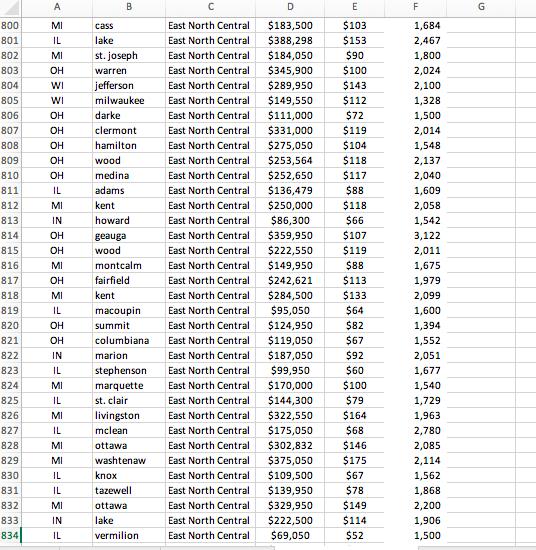
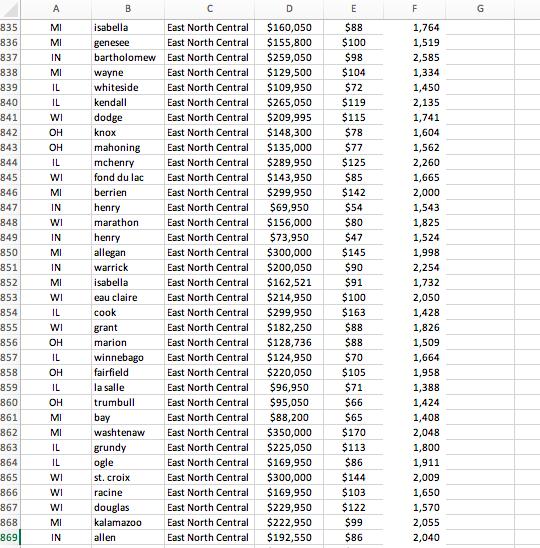
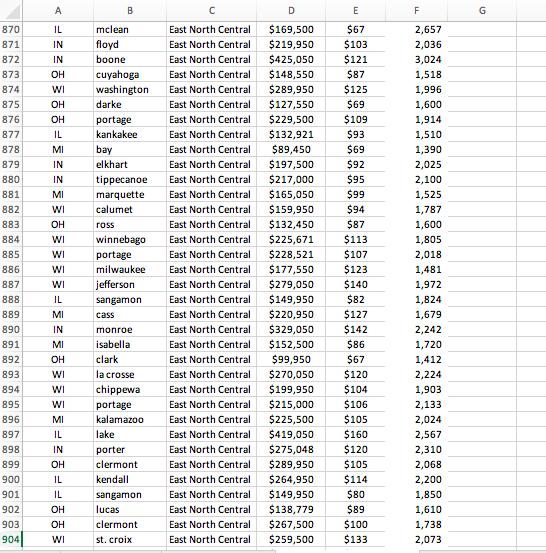
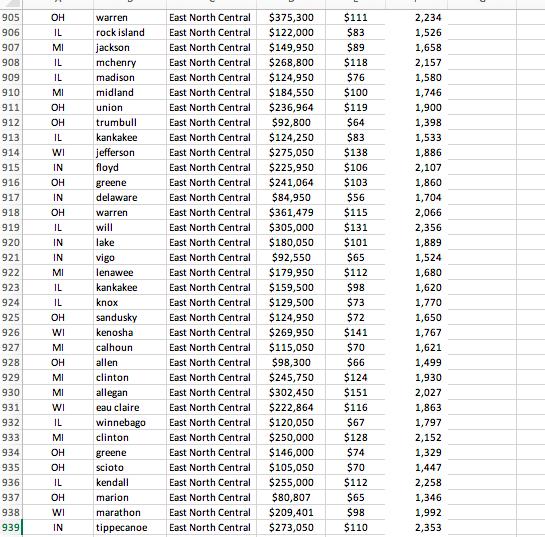
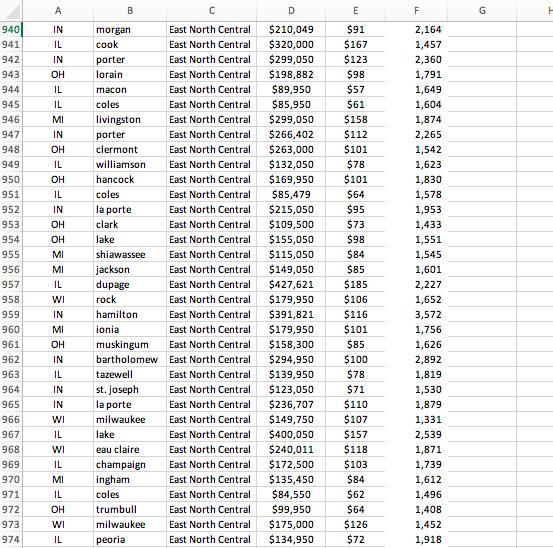
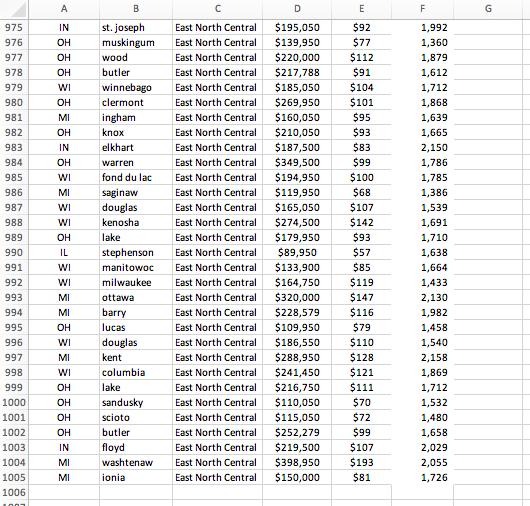
1 House Listing Price Data by Region 2 Regional sample (n = 1001) 3 4 5 SETESDESSNANANAN L M = r = w w = = v = Mwww w 6 7 8 9 10 11 12 13 14 15 16 17 18 19 20 21 22 23 24 25 26 27 28 29 30 31 32 33 State IL MI IN OH IN IL OH WI IN OH OH WI chippewa miami fairfield union clermont mclean adams clinton vermilion clinton oakland OH OH IL IL MI IL MI MI WI WI OH IL OH WI County vermilion washtenaw vanderburgh OH henry stark lawrence kankakee erie kenosha delaware Till grant brown lorain kendall ashtabula columbia darke Region East North Central East North Central East North Central East North Central East North Central East North Central East North Central East North Central East North Central East North Central East North Central East North Central East North Central East North Central East North Central East North Central East North Central East North Central East North Central East North Central East North Central East North Central East North Central East North Central East North Central East North Central East North Central East North Central House listing price $79,995 $381,164 E $257,000 $162,500 $135,000 $219,950 $79,950 $191,360 $350,050 $142,500 $311,950 $182,700 $265,050 $129,950 $259,950 $109,950 Cost per square foot $55 $188 $79 $69 $81 $81 $124,250 $119,950 $146,450 $139,950 $133,050 $216,500 $219,500 $110,000 $68 $182,500 $103 $244,950 $99 $199,950 $102 $185,950 $102 $99 $68 $89 $88 $107 $119 $116 $53 $96 $155 $77 $123 $90 $119 $75 $123 $75 LL Square footage 1,600 2,041 1,558 1,571 1,703 1,668 1,590 1,697 1,665 1,538 1,905 1,747 1,871 1,813 1,599 2,694 1,624 1,896 1,587 1,993 2,282 1,784 2,152 1,889 2,100 1,550 2,027 1,525 v
Step by Step Solution
3.52 Rating (169 Votes )
There are 3 Steps involved in it
Step: 1
Answer The one sample t test is used to solve the problem aboveRighttailed t test is ...
See step-by-step solutions with expert insights and AI powered tools for academic success
Step: 2

Step: 3

Ace Your Homework with AI
Get the answers you need in no time with our AI-driven, step-by-step assistance
Get Started


